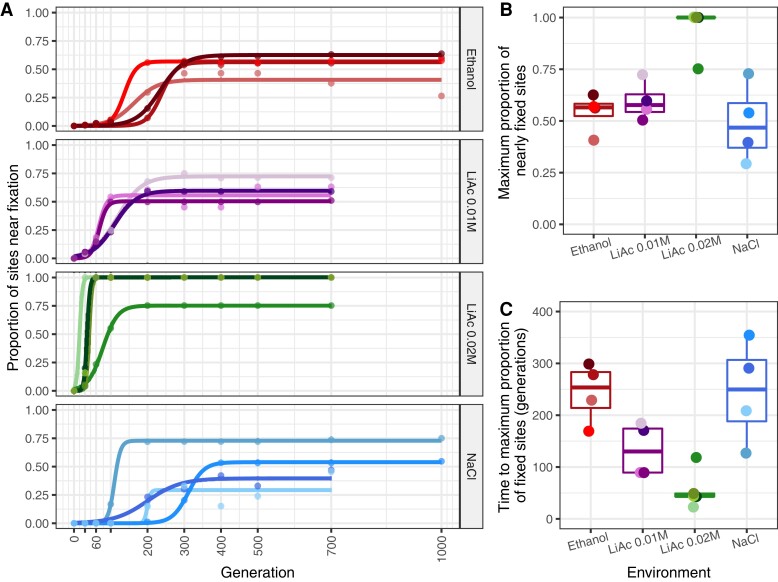
Fig. 4.
Differences in the proportion of nearly fixed sites (MAF ≤ 0.1) across environments. (A) The raw proportion of nearly fixed sites through time (points) were fitted to a sigmoidal model for each replicate, (B) each with their respective maximum proportion of nearly fixed sites, and (C) the time at which each replicate reaches this maximum. There are significant differences between environments with respect to the maximum proportion of nearly fixed sites (Kruskal–Wallis H3 = 10.549, P = 0.014, n = 17) and time to the maximum proportion of nearly fixed sites (Kruskal–Wallis H3 = 11.325, P = 0.010, n = 17), but pairwise Wilcoxon tests were not significant after Bonferroni correction.

