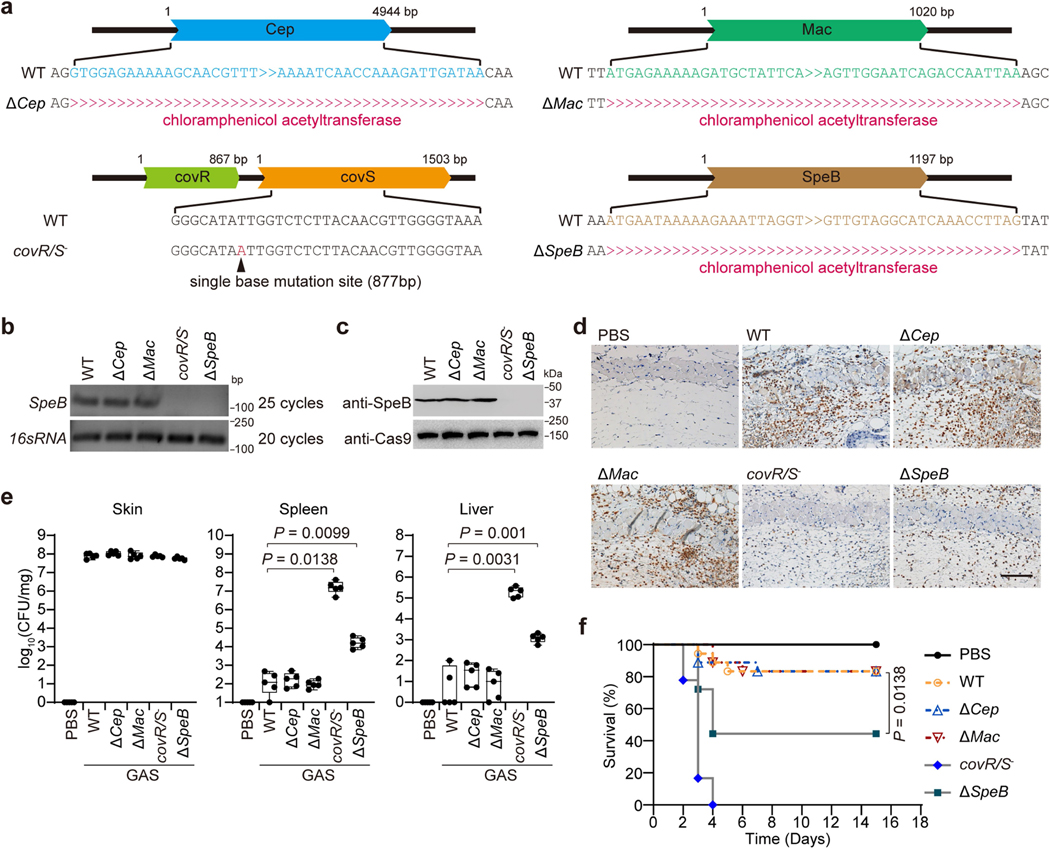
Extended Data Fig. 1 |. SpeB-deficient GAS triggers systemic infection.
a, DNA sequence comparison of GAS isolate M1T1 strain 5448 and its isogenic mutant strains (ΔcepA, Δmac, covR/S− and ΔspeB variants). b, c, RT-PCR (b) and immunoblot analysis (c) of the expression of SpeB in the indicated GAS strains. d–f, mice were infected or not with the indicated GAS strains. d, IHC analysis of neutrophil infiltration at infection site on day 1. Scale bar: 100 μm. e, Bacteria load measured from skin lesions, spleens and livers of mice infected or not with GAS. f, Survival rate of mice challenged or not with the indicated GAS (n = 18 mice per group). e, box plots show all points, min to max (n = 5 mice per group). The center line, upper limit and lower limit of the box denote median, 25th and 75th percentiles and the whiskers denote the minimum and maximum values of data. e, Two-tailed Student’s t-test; f, Mantel-Cox log-rank test. Data are representative of at least three independent experiments. For gel source data, see Supplementary Fig. 1.

