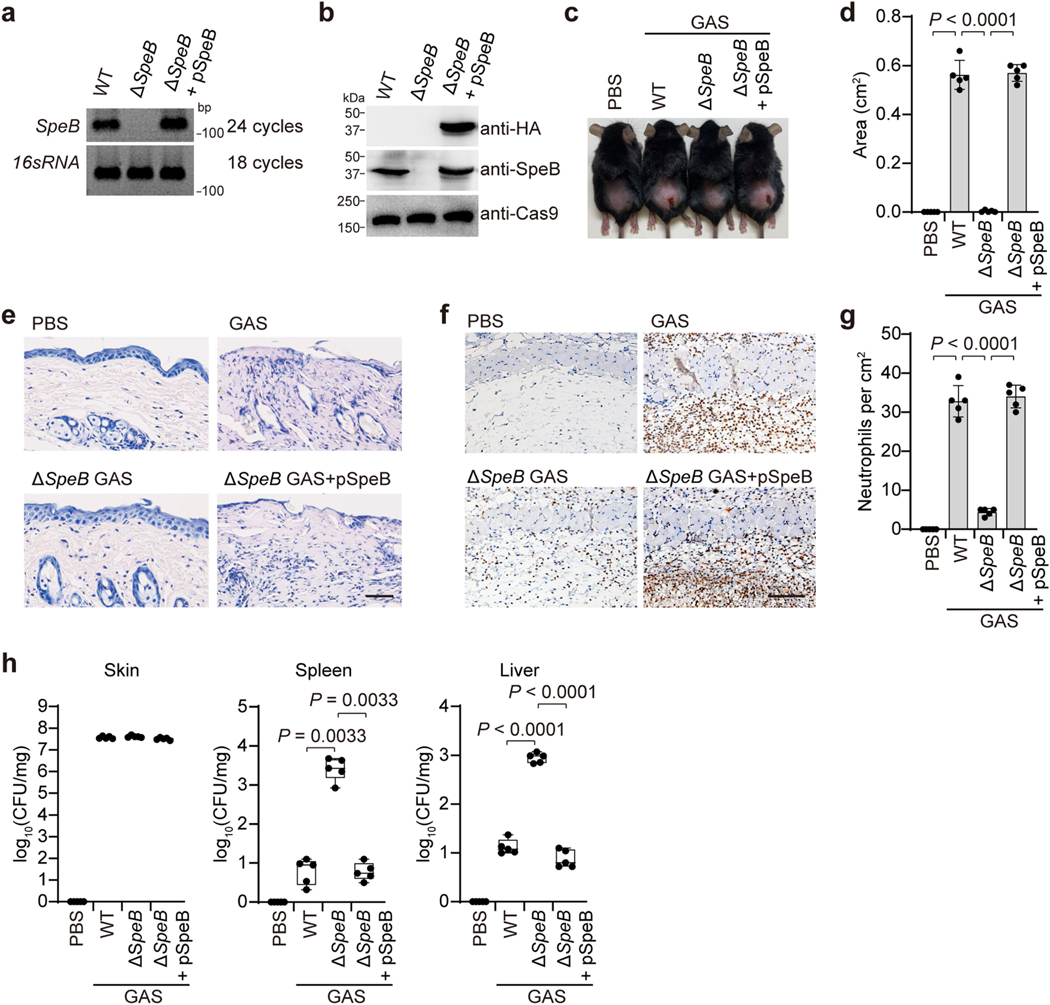
Extended Data Fig. 2 |. SpeB contributes to local tissue destruction.
a, b, The re-expression of SpeB in ΔspeB GAS was confirmed by both RT-PCR (a) and immunoblot analysis (b). c–h, mice were infected or not with the indicated GAS strains. c, Representative image of skin lesions of mice challenged with GAS or not for 1 day. d, Quantification of skin lesion size. e, Histopathology of skin biopsies analysed by H&E staining. f, g, IHC analysis and quantification of neutrophil infiltration at infection site. h, Bacteria load measured from skin lesions, spleens and livers of mice infected or not with GAS. Scale bar: 100 μm. d, g, show mean ± s.d. (n = 5 mice per group); h, box plots show all points, min to max (n = 5 mice per group). The center line, upper limit and lower limit of the box denote median, 25th and 75th percentiles and the whiskers denote the minimum and maximum values of data. d, g, h, Two-tailed Student’s t-test. Data are representative of at least three independent experiments. For gel source data, see Supplementary Fig. 1.

