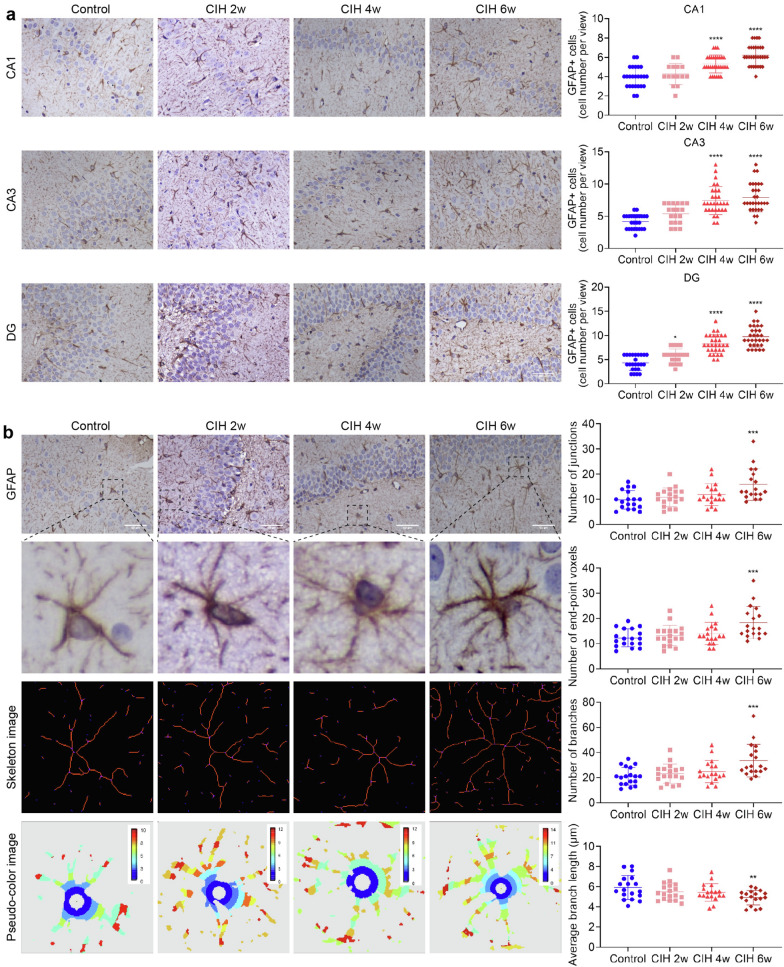
Fig. 3.
CIH induced activation of astrocytes. a GFAP immunohistochemical staining and GFAP + cell count in each subregion of the hippocampus. b Sholl analysis of morphological changes of astrocytes under CIH. Scale bar = 50 μm. Data are presented as the mean ± SD. ANOVA with Tukey’s post hoc test was used to compare the control, CIH 2w, CIH 4w, and CIH 6w group. There were three rat brain slices in each group, and 5–6 visual fields were randomly selected according to different subregions for statistical analysis. *P < 0.05, ***P < 0.001, ****P < 0.0001

