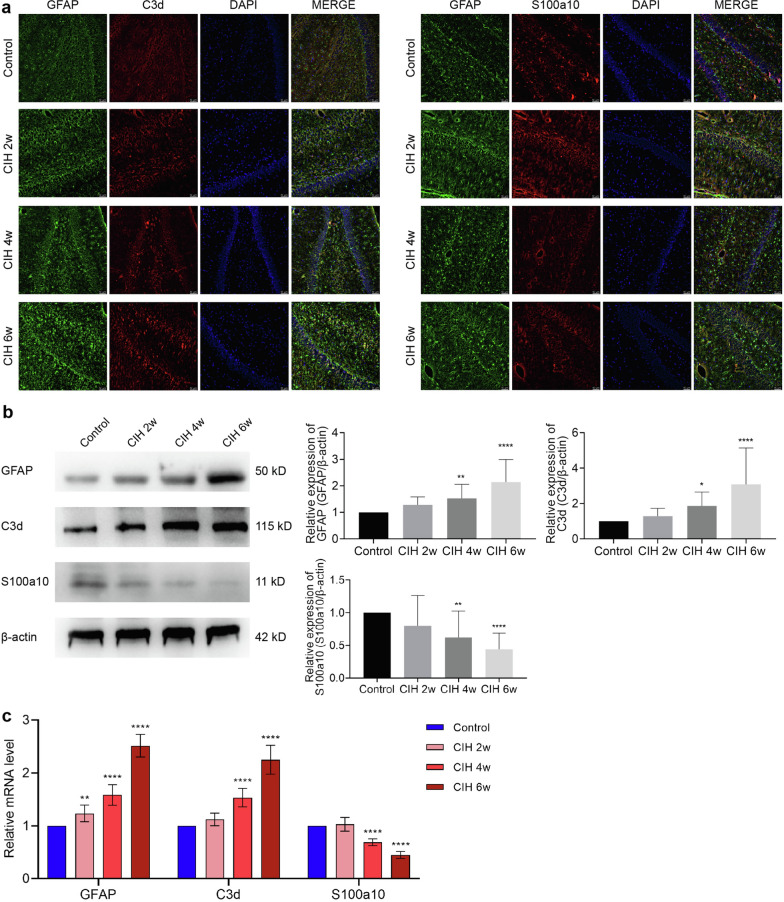
Fig. 4.
CIH induced A1/A2 phenotype astrocyte transformation, with the increase of A1 type. a Immunofluorescence images of astrocytes. The astrocytes were labeled by anti-GFAP (green), anti-C3d (red), and anti-S100a10 (red). b Expression of GFAP, C3d, and S100a10 was detected by Western blotting. c The mRNA expression of GFAP, C3d, and S100a10. Scale bar = 50 μm. Data are presented as the mean ± SD. ANOVA with Tukey’s post hoc test was used to compare the control, CIH 2w, CIH 4w, and CIH 6w groups. For RT-qPCR experiments, each group consisted of 4 rats, and the experiment was repeated 3 times; for western blotting, which was repeated 4 times, there were 5 rats per group. *P < 0.05, **P < 0.01, ***P < 0.001, ****P < 0.0001

