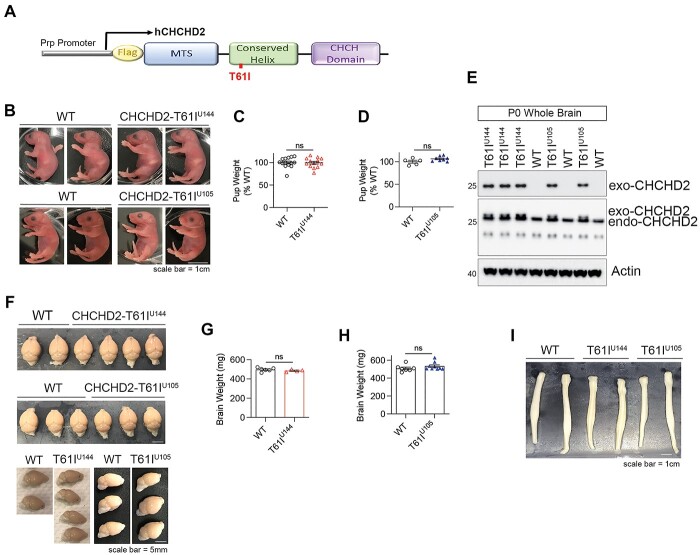
Figure 2.
CHCHD2-T61I Tg mice are viable, fertile and lack gross abnormalities of the brain and spinal cord morphology. (A) Schematic representation of the human CHCHD2-T61I-Flag transgene driven by the mouse Prp promoter. (B) Representative images of postnatal (P0) CHCHD2-T61I Tg line U144 and U105 mice and WT littermates. P0 T61I Tg line U144 and U105 mice are phenotypically normal and feed well, as indicated by the presence of the milk spot (Scale bar: 1 cm). (C) Quantitative analysis of birth weights of CHCHD2-T61I Tg line U144 pups and WT littermates. Error bars represent mean ± SEM; n = 14 WT, n = 13 T61I U144; n.s., not significant. (D) Quantitative analysis of birth weights of CHCHD2-T61I Tg line U105 pups and WT littermates. Error bars represent mean ± SEM; n = 5 WT, n = 8 T61I U105; n.s., not significant. Both strains do not differ in birth weight compared with nontransgenic WT littermates. (E) Representative immunoblots for M2, CHCHD2 and loading control actin from whole brains extracted from P0 CHCHD2-T61I Tg mice. Flag-CHCHD2-T61I transgenic expression is detected by M2 and CHCHD2 antibodies. (F) Representative images of whole perfused brains from 1-year-old CHCHD2-T61I Tg line U144, line U105 and WT littermates (Scale bar: 5 mm). (G) Quantitative analysis of whole brain weights from 1-year-old CHCHD2-T61I Tg line U144 and WT mice. Error bars represent mean ± SEM; n = 7 WT, n = 4 T61I U144; n.s., not significant. (H) Quantitative analysis of whole brain weights from 1-year-old CHCHD2-T61I Tg line U105 and WT mice. Error bars represent mean ± SEM; n = 7 WT, n = 9 T61I U144; n.s., not significant. (I) Representative images of whole spinal cords from 1-year-old CHCHD2-T61I Tg line U144, line U105 and WT littermates. CHCHD2-T61I Tg mice do not show any abnormalities of spinal cord morphology compared with nontransgenic littermates (Scale bar: 1 cm).

