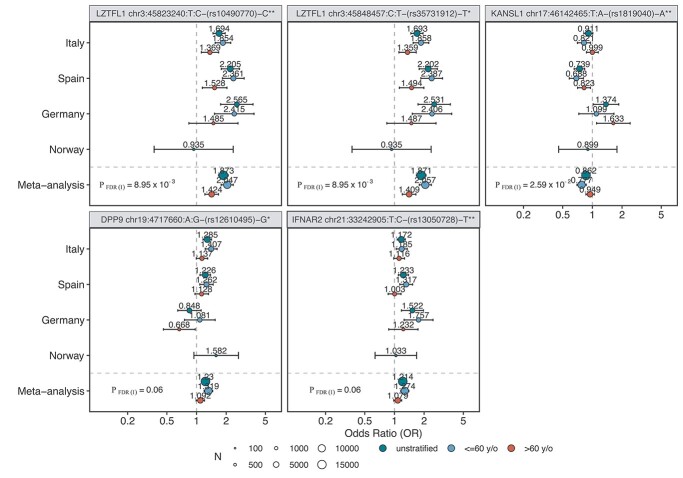
Figure 1.
Forest plot of candidates from the in-depth stratified analysis. The plots show the variants chr3:45823240, chr3:45848457:C:T, chr17:46142465:T:A which were significantly associated with age (interaction P-value [P_FDR(I) < 0.05]) when comparing age groups ≤60 and >60. We additionally show variants chr19:4717660:A:G and chr21:33242905:T:C with insignificant, though strong trends for association with age. ORs and their respective 95% confidence intervals (CIs) are visualized for each of our four cohorts separately. The size of the dots indicates the size of the respective cohort (N). The OR value is displayed in addition as a numerical value. Only cohorts in which N > 50 in both cases and controls are shown. The headers are built as follows: gene variant id (chr:pos(hg38):allele)—rs-id—effect allele */**. * indicates a variant that was observed as associated from data in this study; **indicates a variant that was observed as associated in the release 5 of the COVID-19 HGI.

