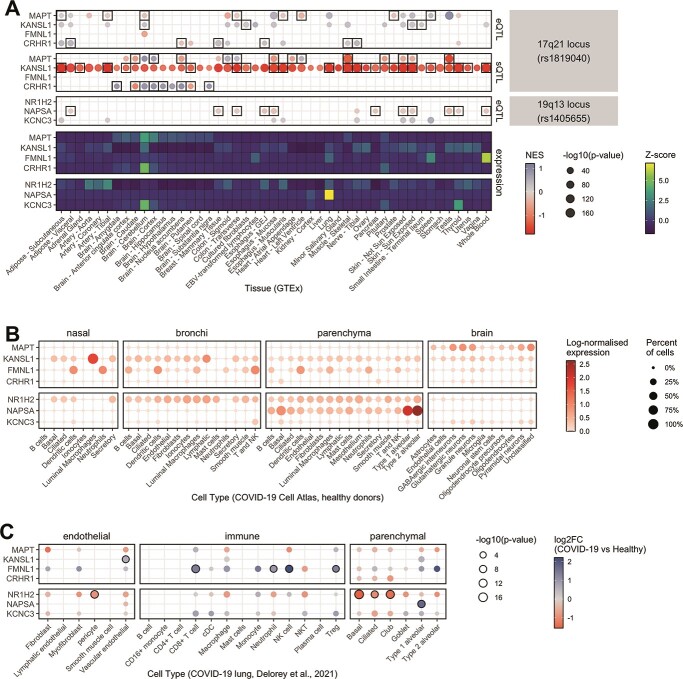
Figure 3.
Expression analysis of the most plausible candidate genes associated with the 17q.21.31 and 19q.13.33 loci in organ tissues and COVID-19 relevant cell types. (A) GTEx tissue-specific expression QTL (eQTL, upper panel) and splicing QTL (sQTL, middle panel) effects of the 17q21.31 and 19q.13.33 loci on selected candidate genes as well as expression of these genes in GTEx (20) tissues (lower panel). The direction of the normalized eQTL and sQTL effect size (NES) of the lead SNP rs1405655 and the inversion tagger rs62055540 in perfect LD with the inversion is represented by color intensities, and statistical significance by dot size. Black rectangles indicate genes for which the expression colocalizes (regional probability > 0.9) with GWAS loci in a given human tissue from the GTEx dataset. Heatmap displays gene-wise centered median by tissue expression values (represented by color intensities), showing in which tissues candidate genes are mostly enriched. (B) Expression levels of candidate genes in scRNA-seq datasets from healthy upper airways (nasal, bronchi) and lung (parenchyma) cells (47) and adult human brain cells from recently deceased, non-diseased donors (48). Figure displays log-normalized mean expression (represented by color) and fraction of cells expressing those genes (indicated by dot size). Processed and cell-type-annotated gene expression levels from studies were retrieved from COVID-19 Cell Atlas (49). (C) The figure shows differential expression of candidate genes in lung cells of COVID-19 patients compared with healthy controls. Log2 fold change (log2FC) values are presented as color gradient. Nominal P-values in −log10 scale are shown proportionally to dot size. Black-bordered circles indicate significantly differentially expressed genes after FDR correction. Results were obtained from pseudo-bulk differential expression analysis by Delorey et al. (21). More detailed figures are shown in Supplementary Material, Figures S11, S12 and S15.

