Figure 5.
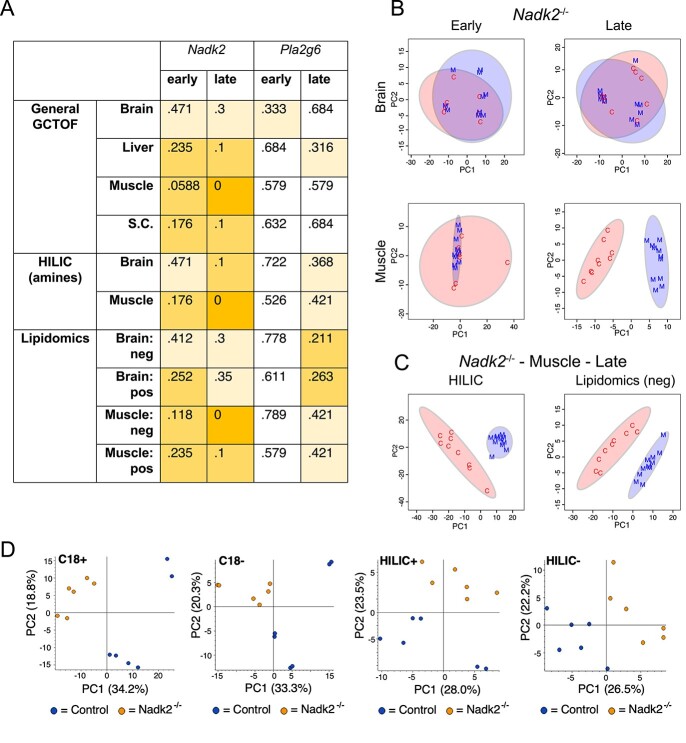
Random forest OOB error rates and PCA scores plots for metabolomics analysis of Nadk2 and Pla2g6 mutant mice versus littermate controls. (A) OOB error rates from random forest analysis of all metabolomics data from mutant mice compared to littermate controls. Scores are color-coded to indicate the magnitude of the error score, with scores of zero shaded dark orange, those between zero and 0.3 shaded medium orange, and those between 0.3 and 0.5 shaded pale orange. The lowest error rates are seen in Nadk2−/− mice at the late time point, especially in muscle samples. (B) PCA score plots of general GCTOF metabolomics data of Nadk2−/− mice (M, blue) versus wild-type littermate controls (C, red) from brain and muscle samples at early and late time points. Separation of the genotype groups is only observed at the late time point in muscle. (C) PCA score plots of HILIC and lipidomics analyses from muscle collected from Nadk2−/− mice at the late time point also display separation from matched wild-type samples. (D) PCA score plots of C18 and HILIC metabolomics in both positive and negative ionization modes for plasma from Nadk2−/− mice and controls at the early time point.

