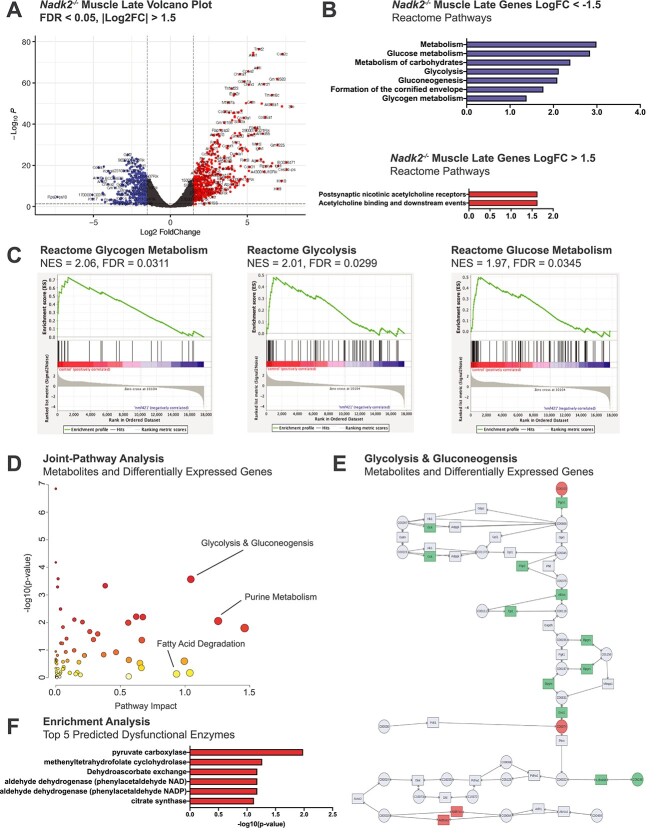
Figure 7.
Transcriptomic and metabolomic analyses of Nadk2−/− muscle at the late time point. (A) Volcano plot of DEGs in skeletal muscle samples of Nadk2 −/− collected at 11 weeks relative to age-matched controls. Genes were filtered using |Log2FC| > 1.5 and FDR < 0.05 cutoffs. (B) Reactome pathway enrichment for filtered genes with negative Log2FC in blue and genes with positive Log2FC in red. Ranked by −log10 of the enrichment P-value. (C) GSEA diagrams for the three top Nadk2 deficiency pathways by FDR value in control relative to Nadk2−/− muscle at the late time point. (D) MetaboAnalyst5.0 joint-pathway analysis plot (gene expression and metabolomics data) depicting significance and impact of pathway disruption in skeletal muscle samples Nadk2−/− mice relative to controls at the late time point. Key pathways are labeled. (E) KEGG pathway diagram of glycolysis and gluconeogenesis color-coded by MetaboAnalyst5.0 to show involvement of differential genes/metabolites from Nadk2−/− mice. (F) Top five dysfunctional enzymes predicted to produce metabolomic signatures similar to that from Nadk2−/− mice using MetaboAnalyst5.0 enrichment analysis functionality. Predicted enzymes are ranked by -log10 of the prediction P-value.

