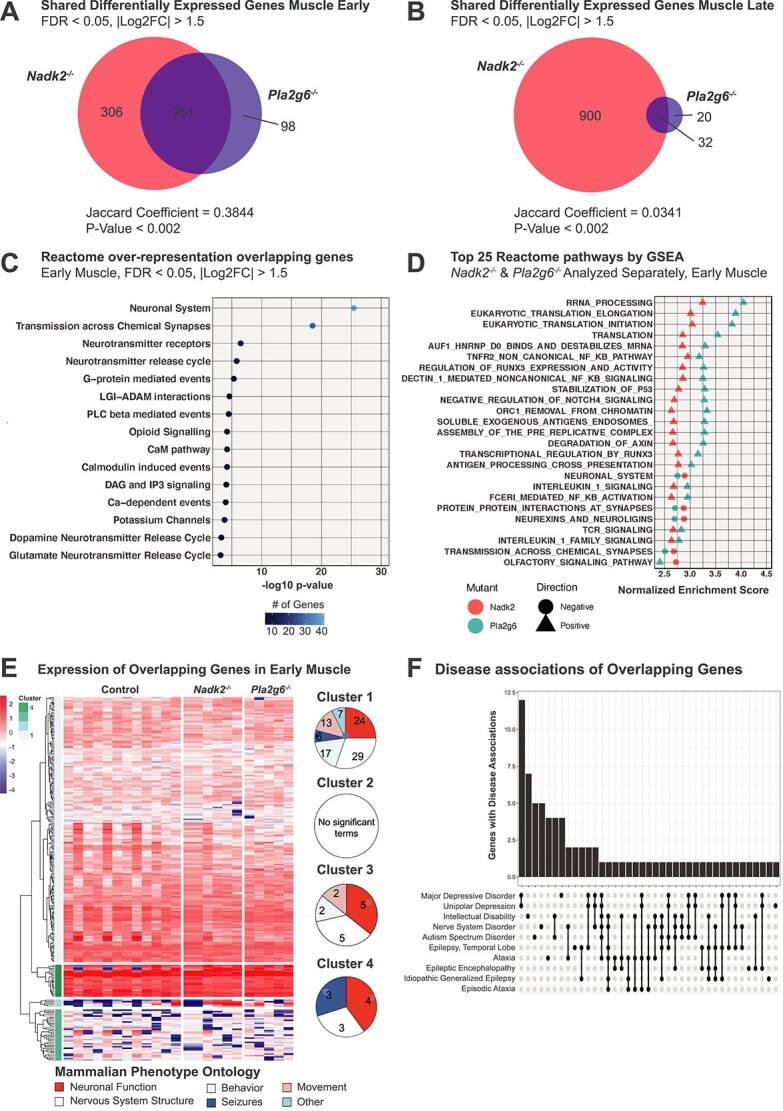
Figure 8.

Comparative transcriptomic analysis of Nadk2 and Pla2g6 mutants. (A) Venn diagrams depicting overlapping DEGs in Nadk2−/− and Pla2g6−/− muscle at the early time point. (B) Venn diagram depicting overlapping DEGs in Nadk2−/− and Pla2g6−/− at the late time point. |Log2FC| > 1.5 and FDR < 0.05 cutoffs applied. Jaccard coefficients and significance of overlap from GeneWeaver. (C) Reactome pathway terms associated with DEGs shared between Nadk2−/− and Pla2g6−/− muscle at the early time point. Color indicates the number of genes associated with each ontology term. (D) Top 25 Reactome pathways by absolute normalized enrichment score with FWER < 0.05 implicated by gene set enrichment analysis shared between Nadk2−/− and Pla2g6−/− muscle at the early time point. Color indicates genotype and shape differentiates positive and negative normalized enrichment scores. (E) Heatmap and dendrogram depicting expression levels of DEGs shared between Nadk2−/− and Pla2g6−/− mice in muscle tissue at the early time point. Genes are clustered into four groups based on the similarity of gene expression patterns across samples. Mammalian phenotype ontology terms for each cluster are grouped into major categories, and the representation of major categories in each cluster is presented as circular plots. (F) Upset plot of gene–disease associations from human orthologs of DEGs that overlap between Pla2g6−/− and Nadk2−/− early muscle tissue.
