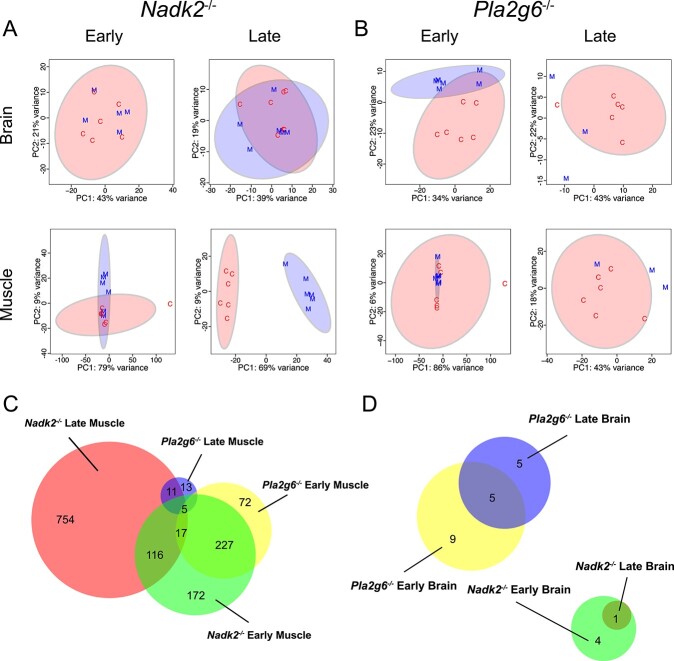
Figure 4.
PCA plots and differential expression analysis of the transcriptome of Nadk2−/− and Pla2g6−/− mice. (A) PCA plots of DEGs from brain and muscle of Nadk2−/− mice (M, blue) compared to wild-type littermate controls (C, red) at early and late time points. Clear separation of the genotypes is seen only at the late time point in muscle. (B) PCA plots of DEGs from brain and muscle of Pla2g6−/− mice compared to wild-type littermate controls at early and late time points. Plots indicate little separation of the transcriptomes from the two groups. (C, D) Venn diagrams comparing the number of DEGs and their overlap between the indicated genotypes and time points for muscle (C), and brain (D).

