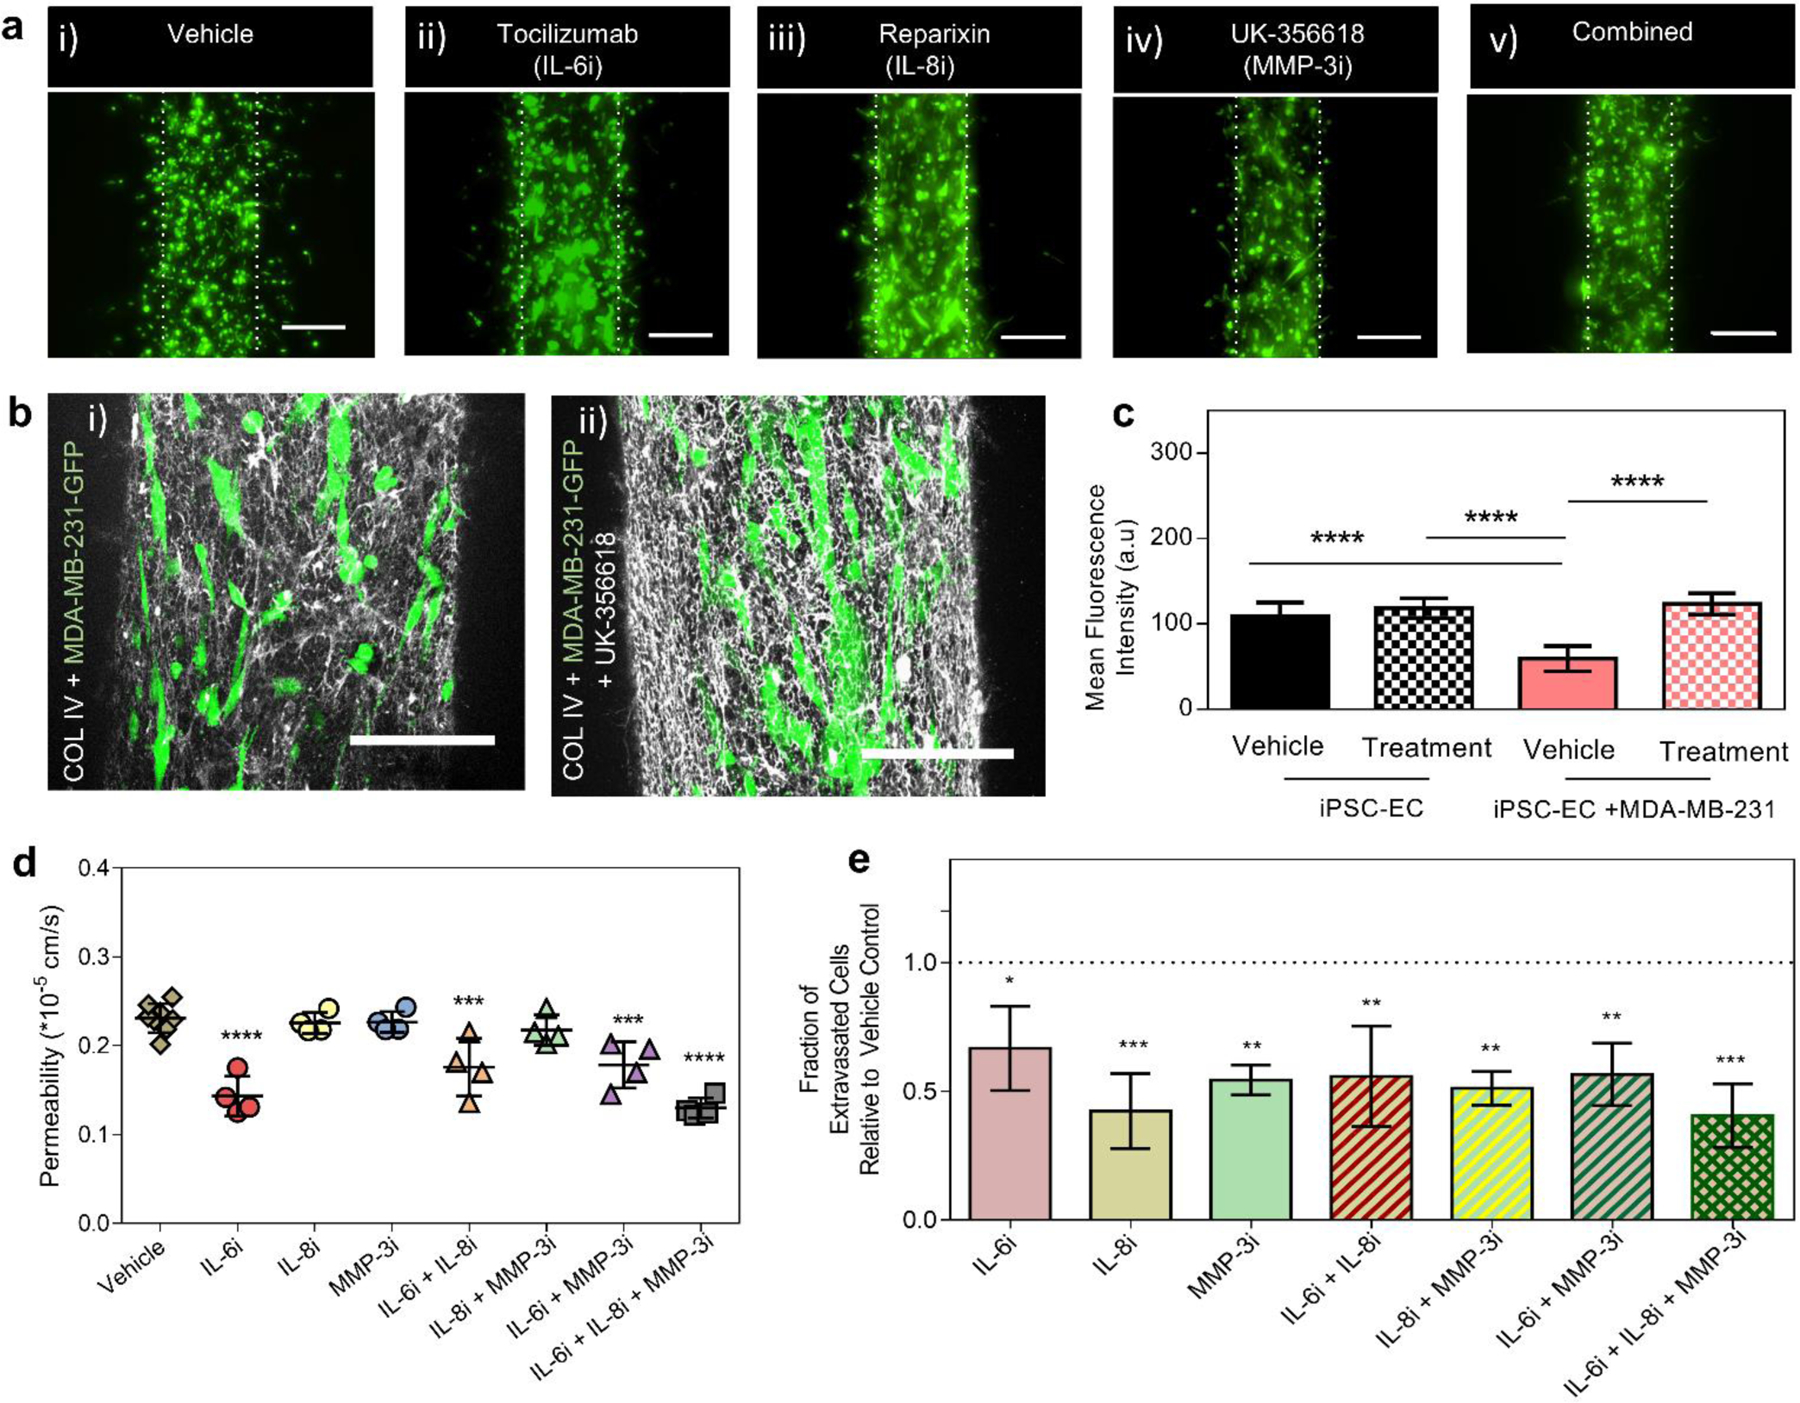
Figure 7. Functional responses (vessel permeability, basement membrane remodeling and extravasation events) of systems treated with therapeutic inhibitors.

(a) Fluorescent image projections of MDA-MB-231 cell extravasation events in response to vehicle control (i), tocilizumab treatment (IL-6R, ii), reparixin treatment (IL-8R, iii), UK-356618 treatment (iv), and combination treatment (v), scale bars indicate 200 µm. (b) Confocal projection images showing COL IV deposition on vehicle control (i) and UK-356618 treated iPSC-EC vessels in direct-contact co-culture with MDA-MB-231 cells (ii), scale bars indicate 150 µm. (c) Mean fluorescence intensity analysis of COL IV deposition on vehicle control and UK-356618 treated systems. Plot: mean fluorescence intensity + SD, statistical analysis: ordinary one-way ANOVA with Tukey’s multiple comparisons test, ****p ≤ 0.0001. Data represents average of at least 6 different region of interests (ROIs) across 4 different systems.(d) Permeability analysis of iPSC-EC vessels for seven treatment conditions including vehicle control, independent treatment of each inhibitors and their combinations. Plot: mean permeability + SD, statistical analysis: one-way ANOVA followed by Dunnett multiple comparison test, ****p ≤ 0.0001, **p ≤ 0.01, compared with vehicle (n=4–6). (e) Relative fraction of extravasation events for seven treatment conditions examined relative to vehicle control. Plot: relative fraction of extravasated cells + SD, statistical analysis: one-way ANOVA followed by Dunnett multiple comparison test, *p ≤ 0.05, **p ≤ 0.01, ***p ≤ 0.001, compared with vehicle (n=4).
