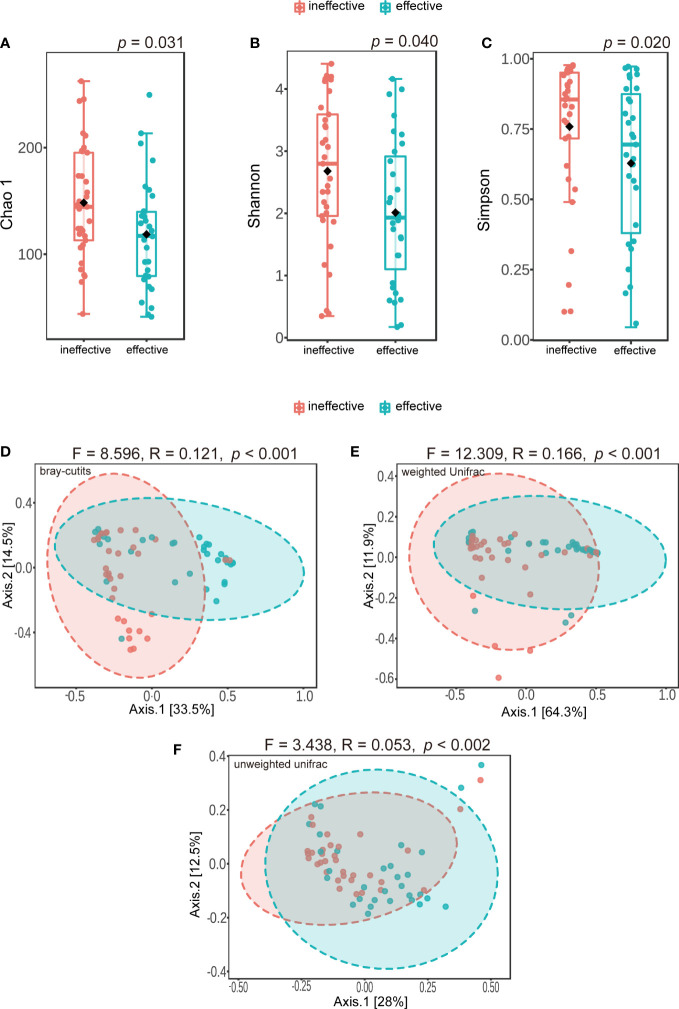
Figure 2.
Alpha-diversity and principal coordinate analysis for urinary microbiomes between ineffective group and effective group. (A) Chao 1 (B); Shannon index (C); Simpson index (D); Principal coordinate analysis plot of the urinary microbiome based on bray-curits (E); or weighted Unifrac (F); or unweighted Unifrac.

