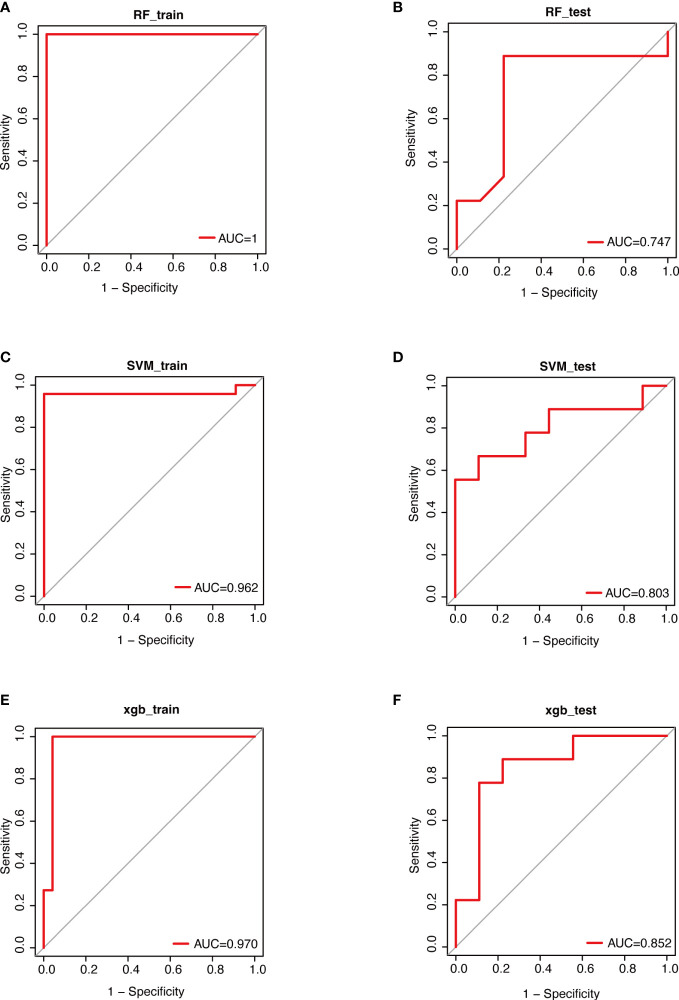
Figure 5.
Performance evaluations of therapeutic effects based on 3 algorithms. Data were randomly divided into a training set and a testing set according to 7:3. ROC curves for evaluating the predictive performance of the therapeutic effect. (A); the training set of RF (B); the test set of RF (C); the training set of SVM (D); the testing set of SVM (E); the training set of XGBoost (F); the testing set of XGBoost. RF, Random Forest; SVM, Support Vector Machine; XGBoost, eXtreme Gradient Boosting.

