
Figure 1. Alu editing index throughout human brain development and neuronal maturation.
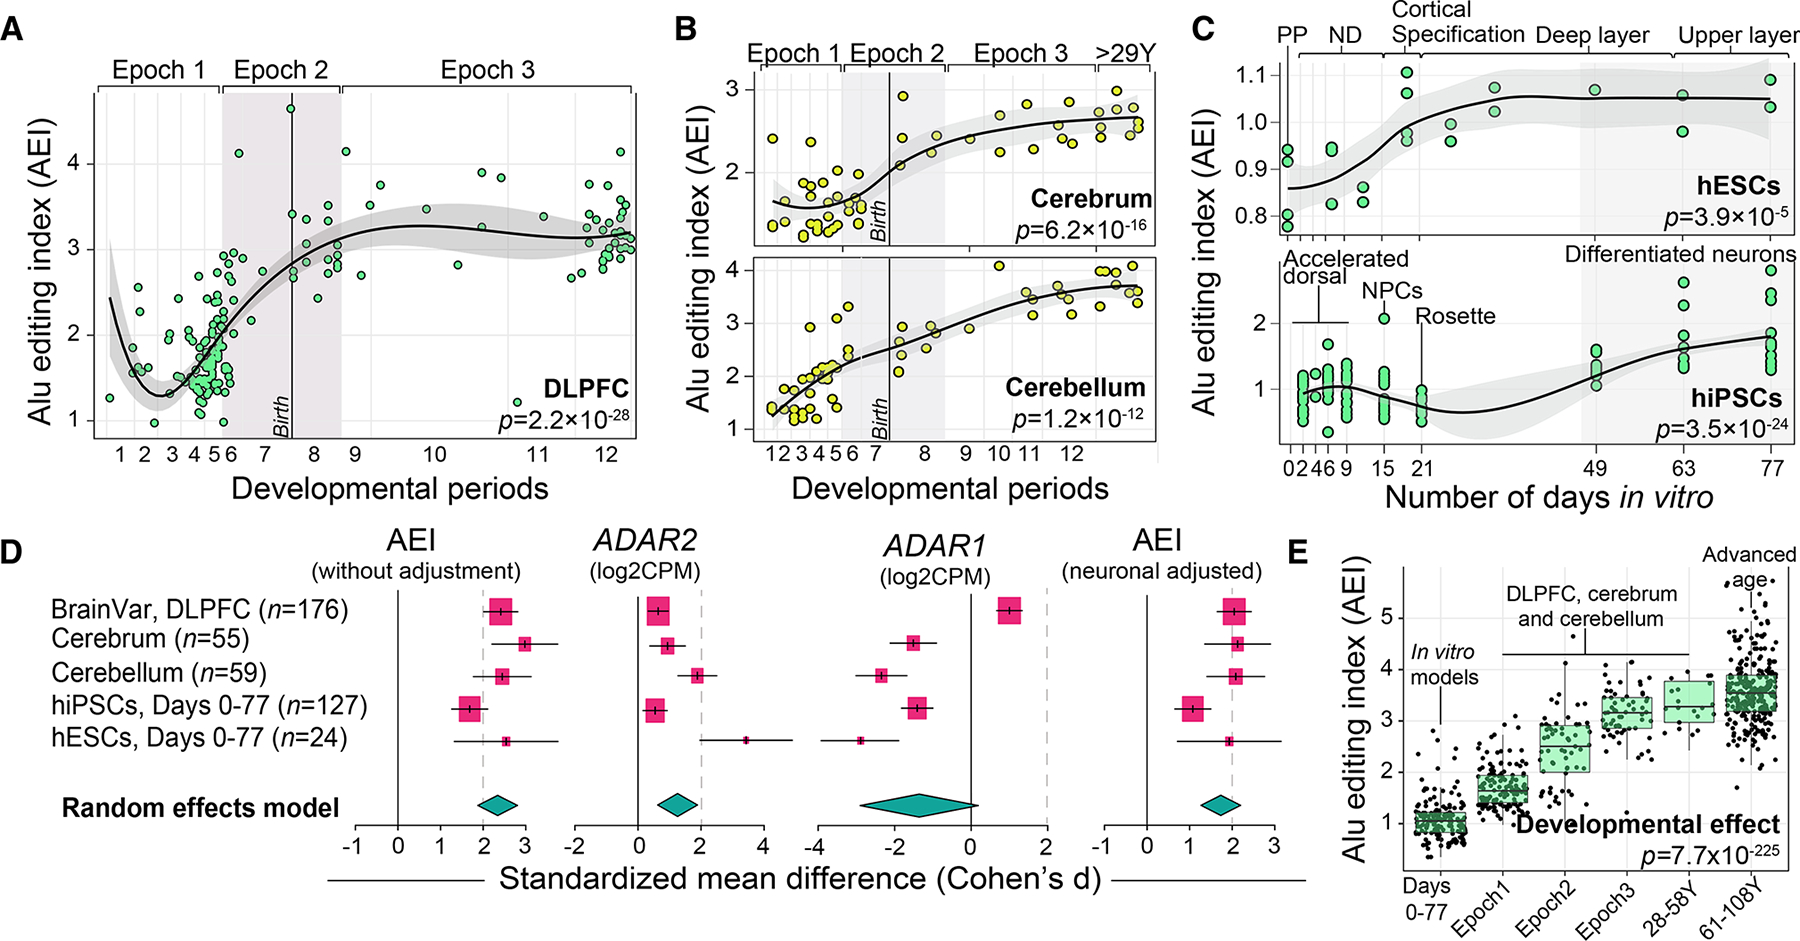
(A and B) Alu editing index (AEI; y axis) was computed for (A) DLPFC (n = 176), (B) cerebrum (n = 55) and cerebellum (n = 59), across 12 developmental periods (log age, x axis). Periods 1–7 reflect prenatal windows and periods 8–12 reflect postnatal windows. The late fetal transitional period (epoch 2) is shaded in gray.
(C) The AEI (y axis) throughout 77 days of neuronal maturation (x axis) in human embryonic stem cells (hESC; n = 24) and human induced pluripotent stem cells (hiPSCs; n = 127). Abbreviations depicting specific stages are described in the STAR Methods. Loess curves were used to fit the data. Two-sided linear regression was used to test for significance.
(D) Meta-analysis of the AEI (with and without neuronal adjustment), ADAR2, and ADAR1 across all datasets. Standardized mean difference (Cohen’s d) compared the differential change in these measures over the course of neuronal maturation and development. A random effects model computed the pooled effect size across all five independent datasets. Confidence intervals (95%) are denoted around each effect size and the size of each box scales with the relative sample size of each study.
(E) The AEI (y axis) compiled across 702 developmentally distinct transcriptome samples (x axis), including samples from normal aging (n = 261). Two-sided linear regression was used to test for significance. All boxplots show the medians (horizontal lines), upper and lower quartiles (inner box edges), and 1.5× the inter-quartile range (whiskers).