
Figure 2. Identification and annotation of selective editing sites.
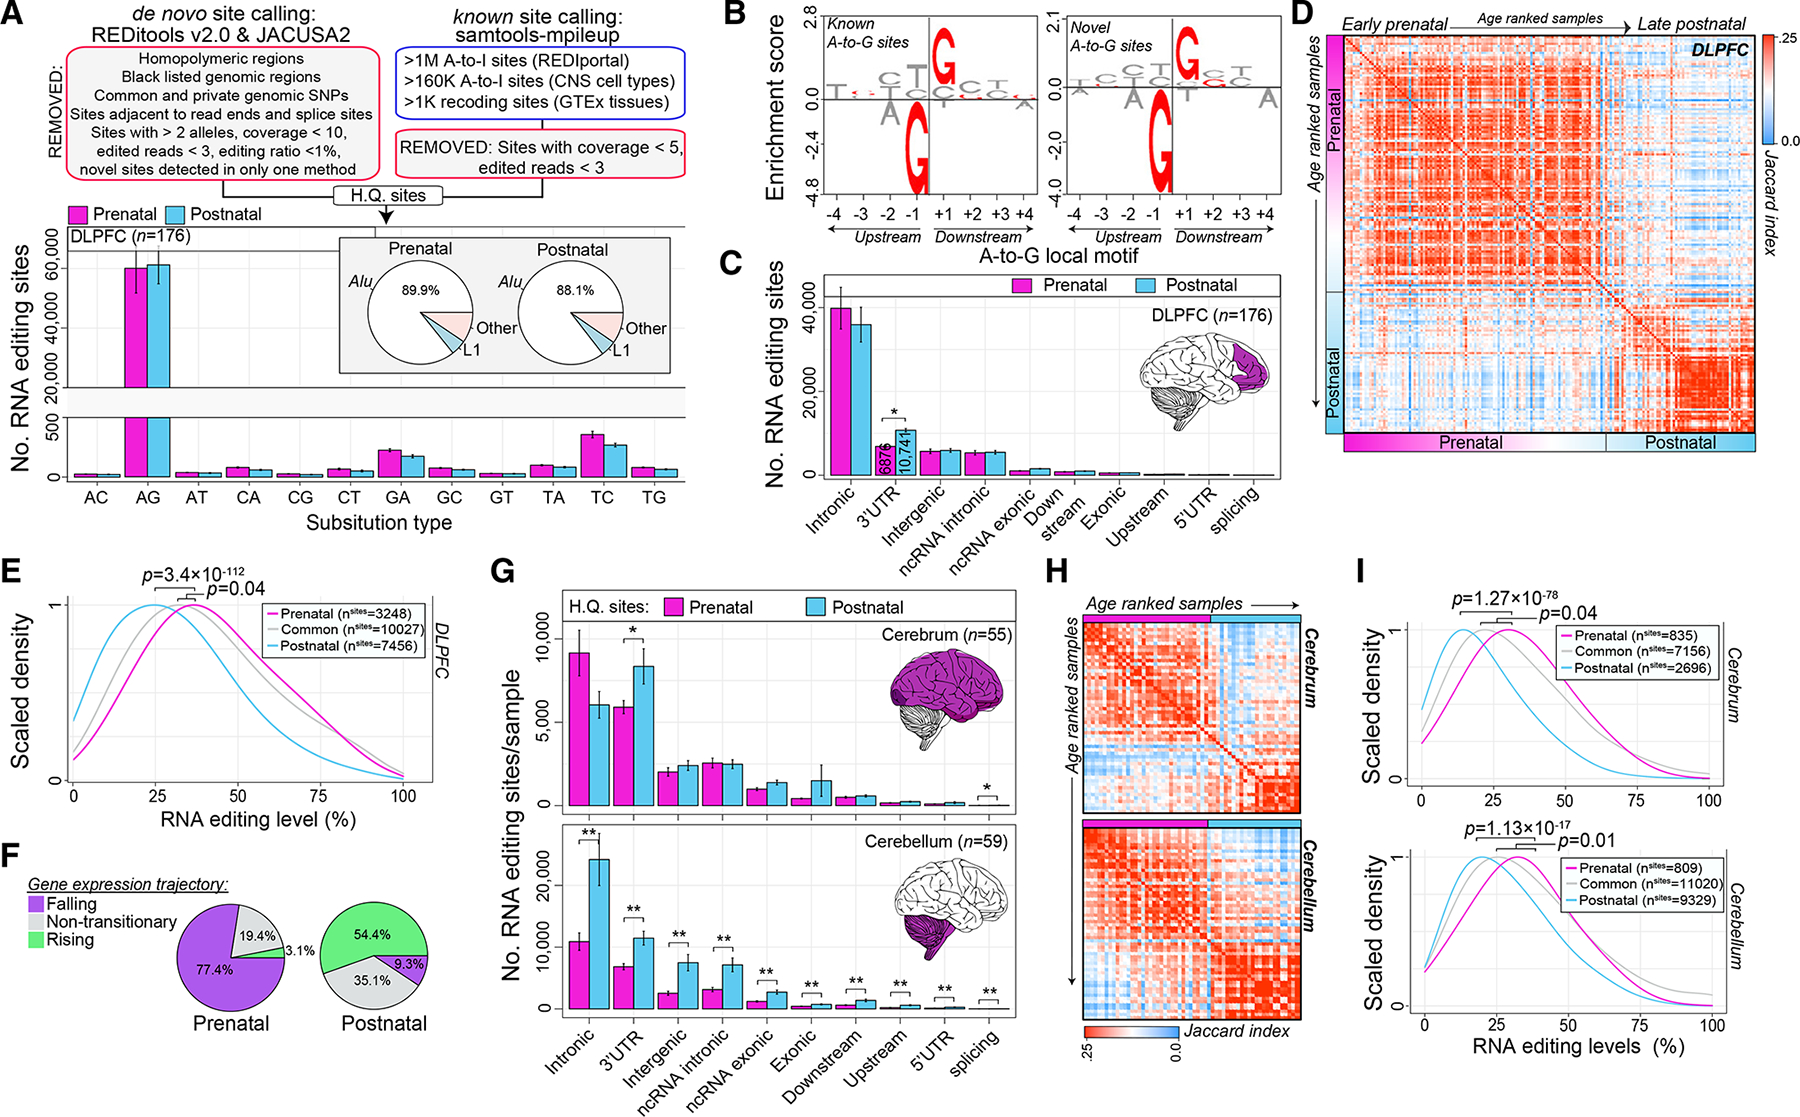
(A) Uncovering high-quality (HQ) sites (top). Bar plots depict mean (with standard error) number of HQ sites for DLPFC prenatal (n = 116) and postnatal (n = 60) samples based on substitution type and repeat element (bottom).
(B) Known and not-in-catalog A-to-G sites enrich (y axis) for a common sequence motif featuring a depletion and enrichment of guanosines 1 bp (±) the target adenosine.
(C) Bar plots depict mean number of sites (with standard error) per genic region for prenatal and postnatal samples, respectively. Two-sided Student’s t test tested for significance.
(D) Jaccard index measures pairwise overlaps of HQ sites detected per sample (red, high; blue, low). Samples are age ranked from early fetal to late postnatal ages.
(E) Differences in editing levels for prenatal specific sites relative to common and postnatal specific sites in the DLPFC. Two-sided Mann-Whitney U test tested for significance.
(F) Prenatal- and postnatal-specific sites parsed by corresponding temporal gene expression trajectories.
(G) Bar plots depicting mean (with standard error) number of HQ sites per genic region for cerebrum (n = 55; top) and cerebellum (n = 59; bottom) samples. Two-sided Student’s t test tested for significance.
(H) Jaccard index measures pairwise overlaps of all HQ sites detected per sample in the cerebrum (top) and cerebellum (bottom).
(I) Differences in editing levels for prenatal specific sites relative to common and postnatal specific sites in the cerebrum (top) and cerebellum (bottom). Two-sided Mann-Whitney U test tested for significance.