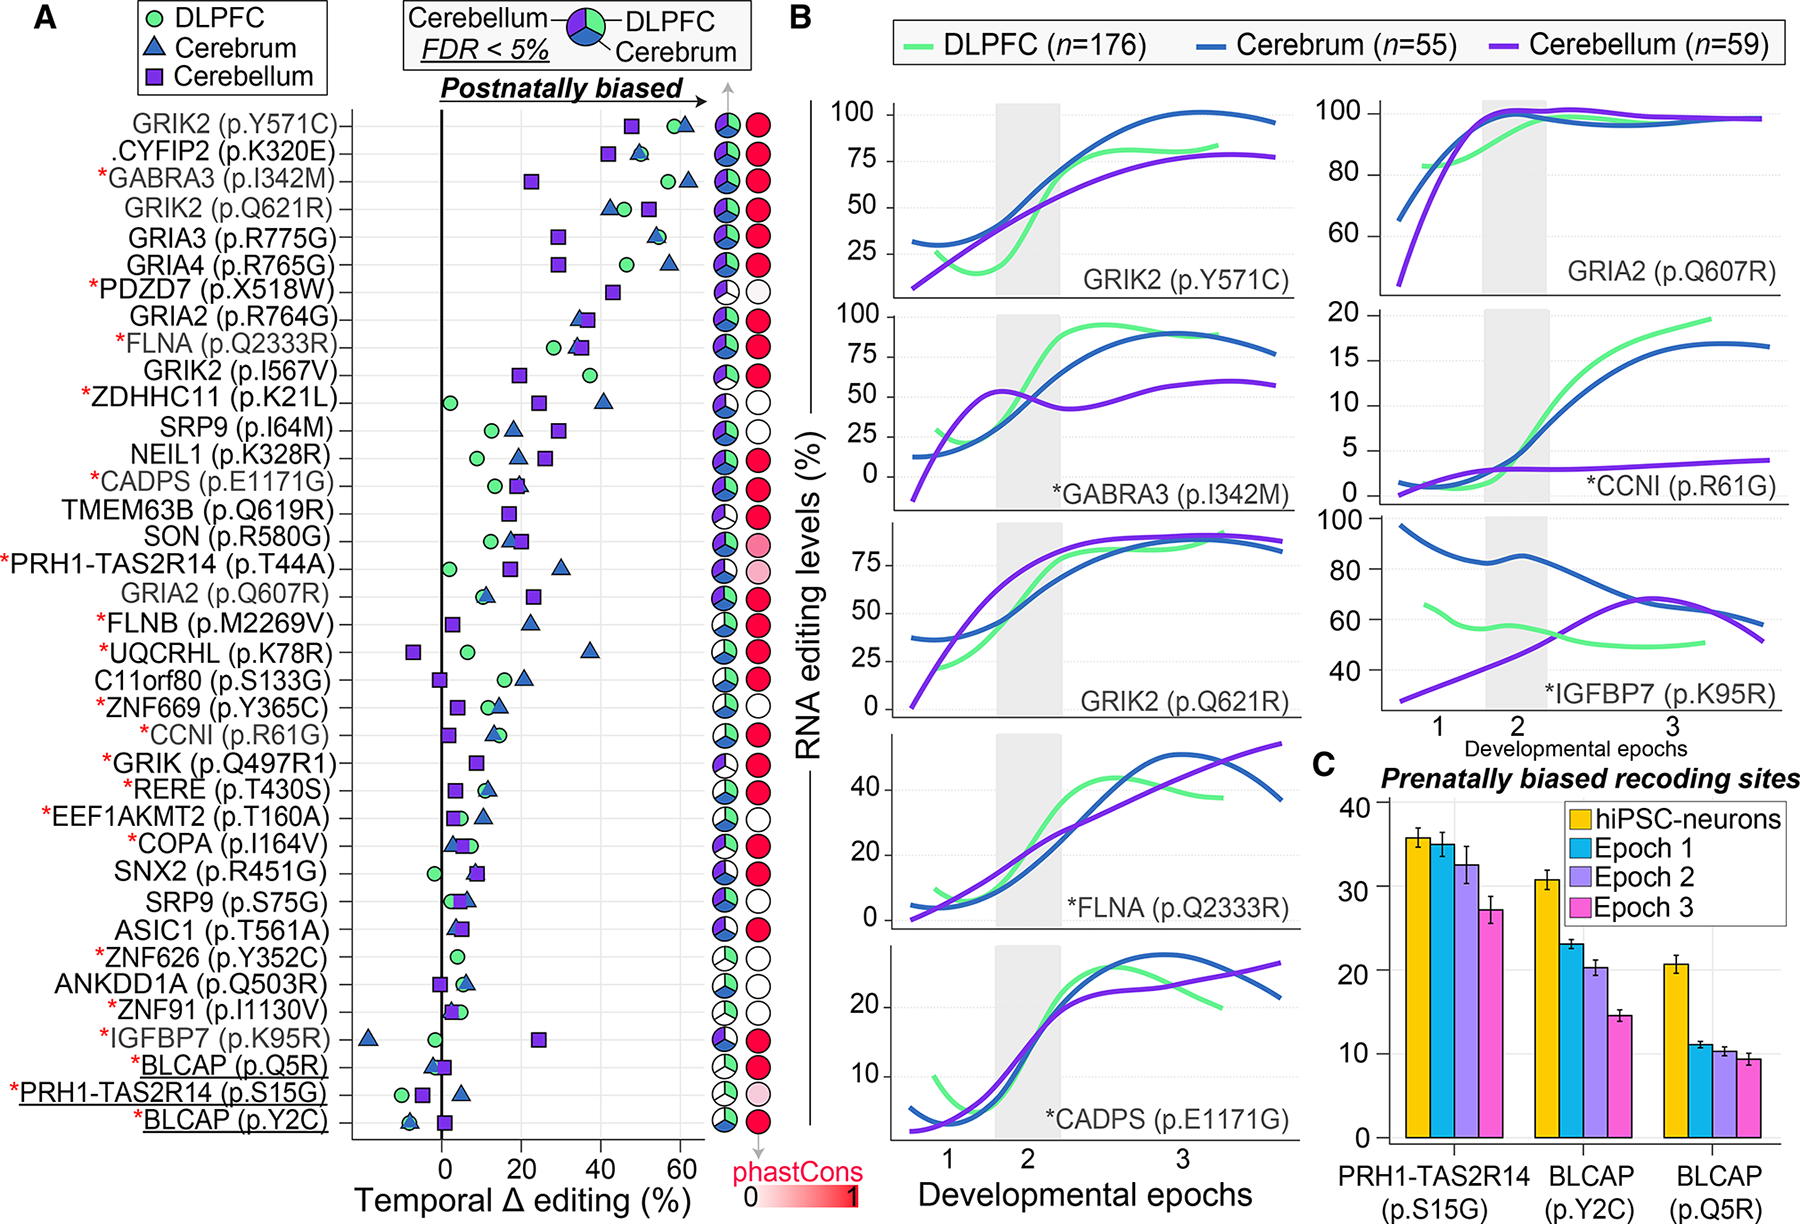
Figure 4. Spatiotemporal dynamics of RNA recoding sites across development.

(A) Ranking of 37 recoding sites (y axis) by temporal effect sizes (delta editing rates; x axis) between prenatal and postnatal periods. Each recoding site exhibits a significant change in editing levels in at least one anatomical region. Pie charts indicate where a recoding site is significantly temporally regulated (FDR < 5%). PhastCons scores represent probabilities of negative selection and range between zero (white) and one (red). Red asterisks (*) indicate sites that validate in mature hiPSC-derived neurons.
(B) Examples for eight spatiotemporally recoding sites with significant changes in editing levels (y axis) across development (log age, x axis) in the DLPFC (n = 176), cerebrum (n = 55), and cerebellum (n = 59). These sites include well-known sites (e.g., GRIK2 [p.Y571C], GRIA2 [p.Q607R]) and other sites with unexplored roles in neurodevelopment. The late fetal transition (epoch 2) is shaded in gray. Loess curves were used to fit the data.
(C) Fetal validation of the three prenatal specific recoding sites in mature hiPSC-derived neurons (day 77; n = 30) relative to the DLPFC.
