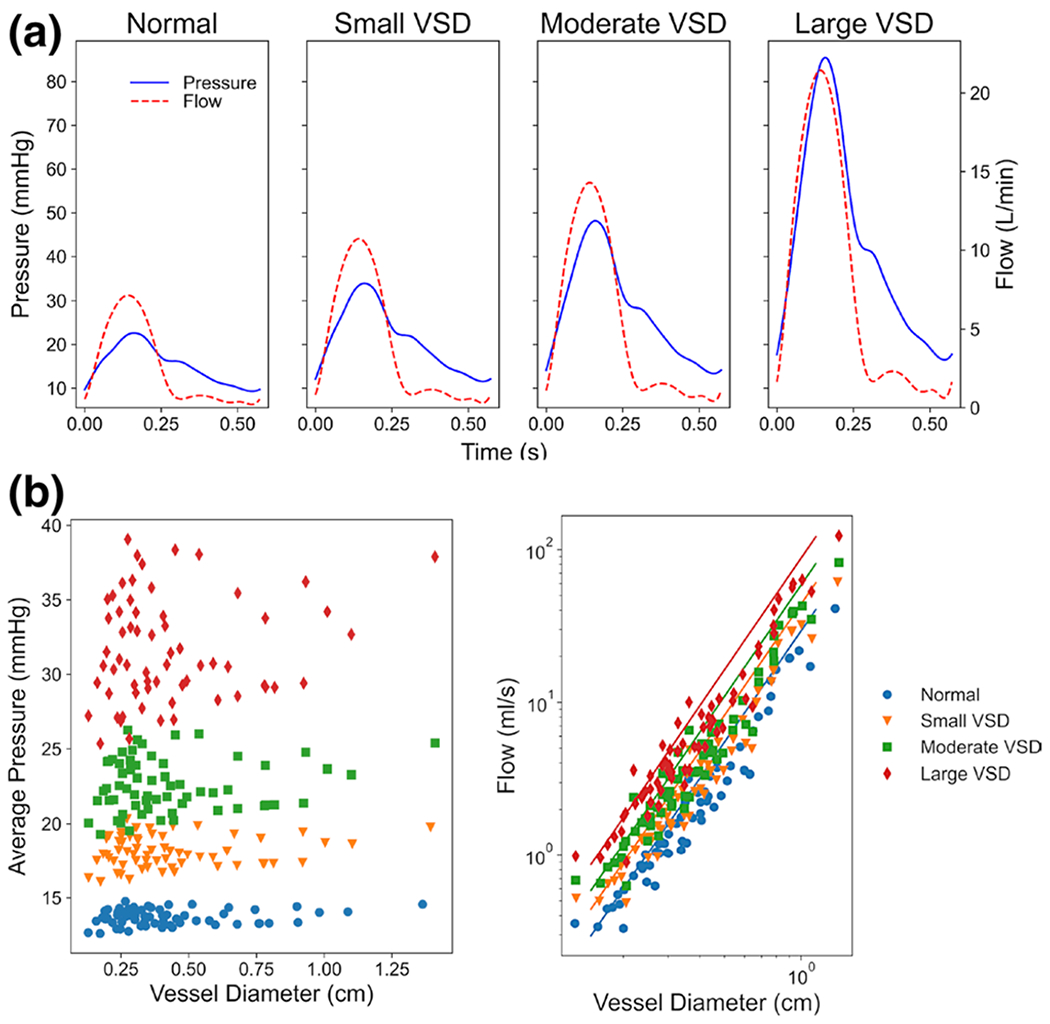
Fig. 4.

The 3D hemodynamic simulations show a the pressure (blue) and flow (red) in the MPA increasing with increased VSD severity, b the spatially and temporally averaged pressure in all segments increasing with VSD severity, and c the average flow in all segments increased with a power law of diameter (represented by solid lines) for all VSD conditions
