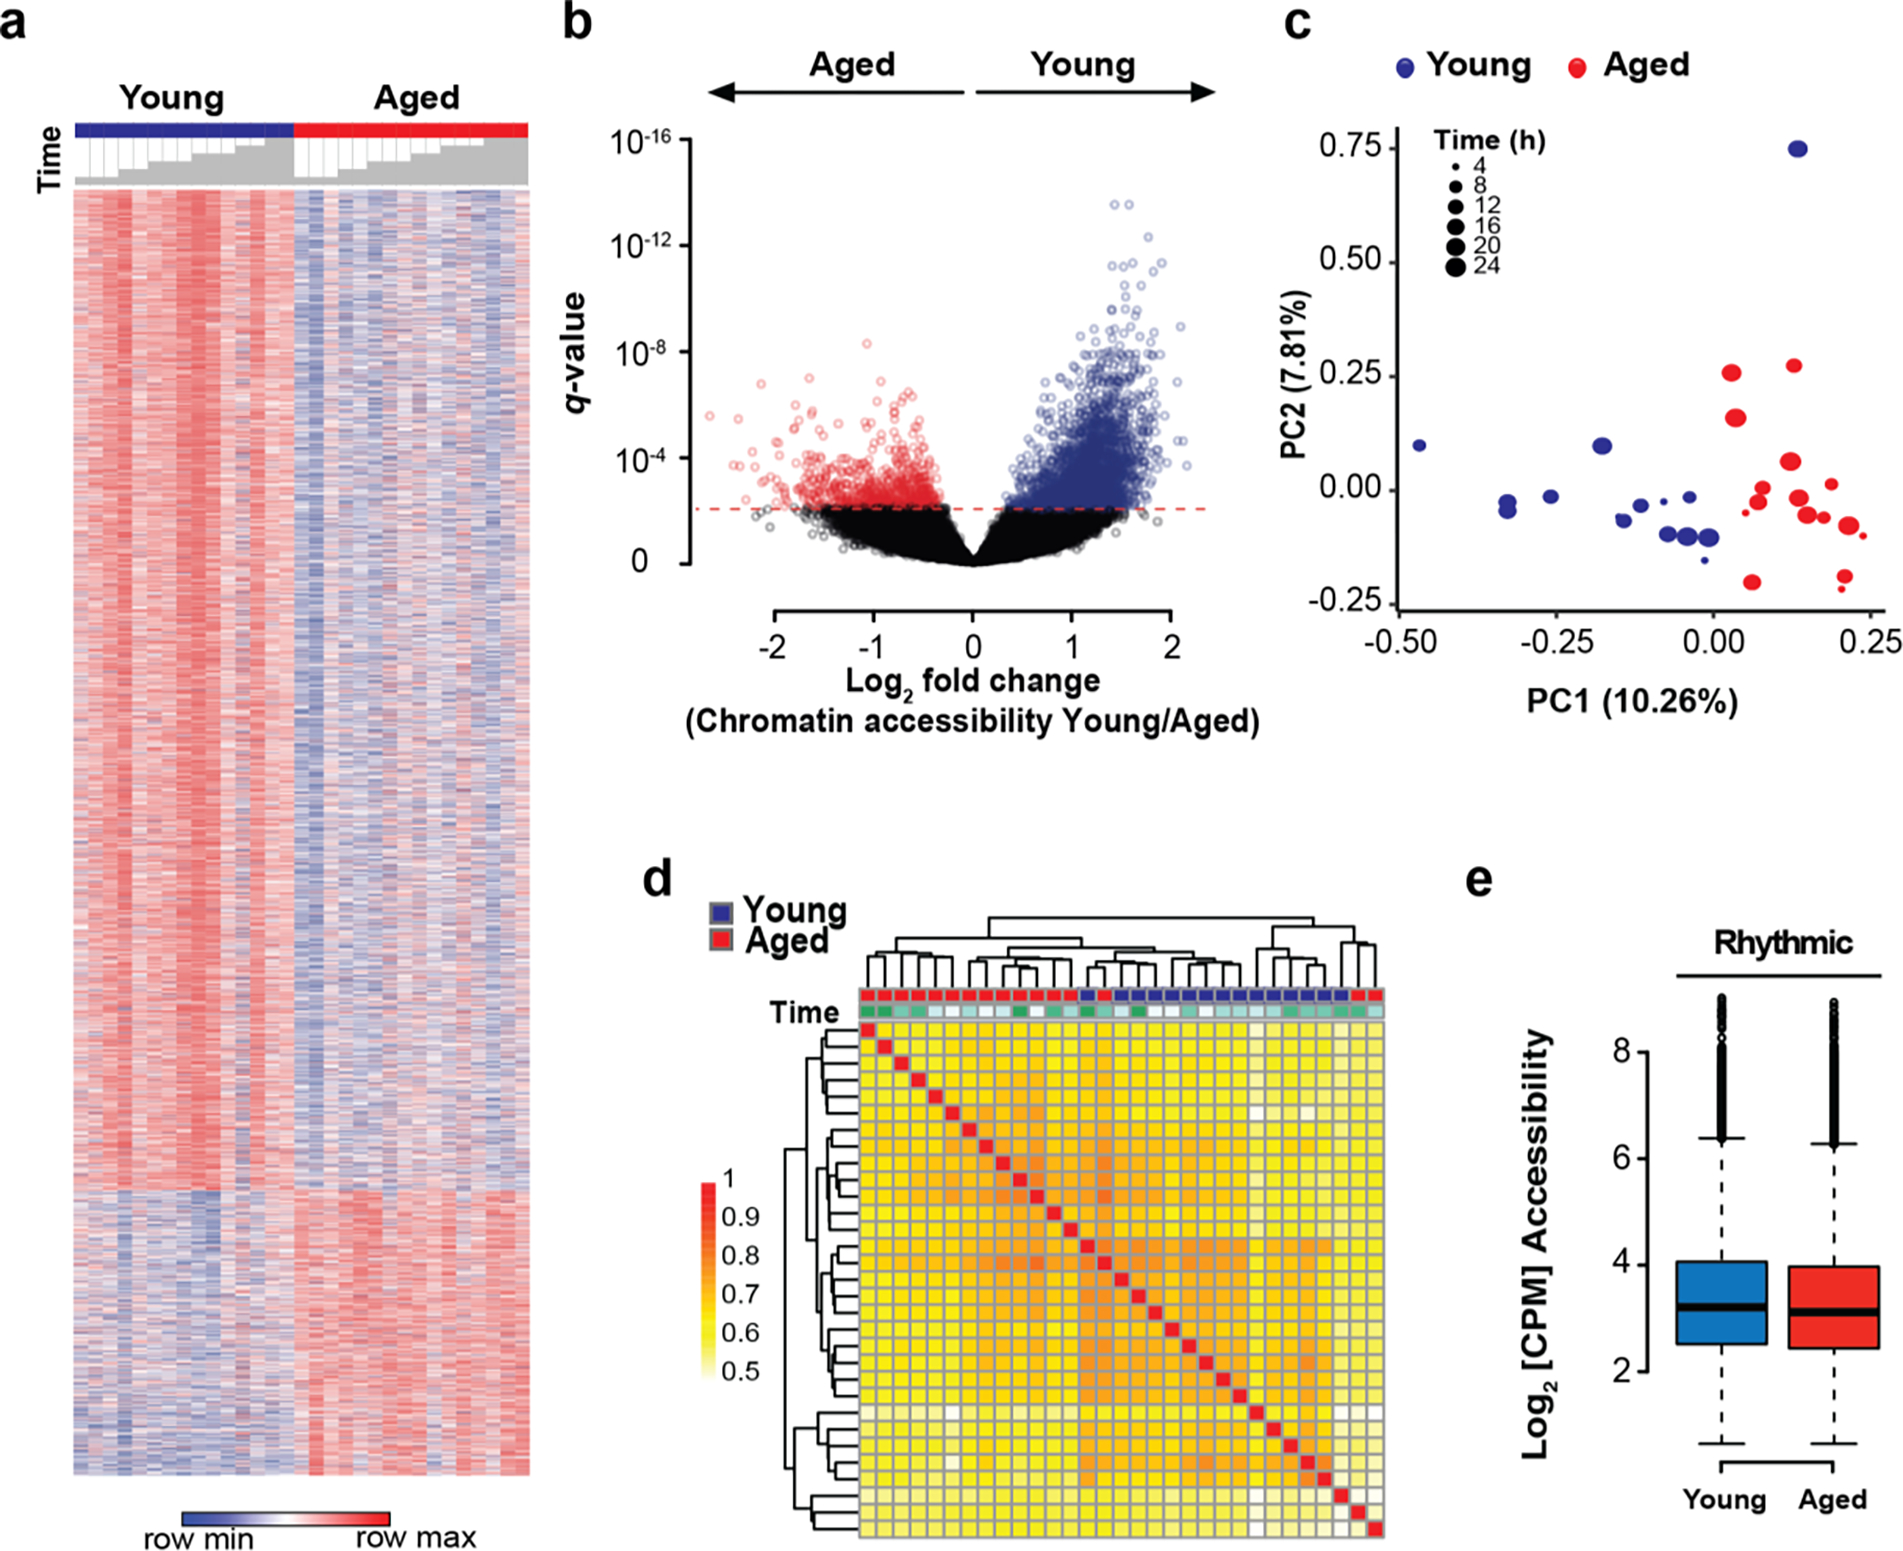
Figure 3. Chromatin accessibility is globally decreased in aged macrophages but does not account for loss of diurnal transcription.

a. Heatmap of differential chromatin accessibility peaks in young vs. aged peritoneal macrophages over a 24-hour cycle at 4h intervals; n=15–16 mice in each age group and n=2–3 mice per 4 h time interval. Time is indicated with grey bars above the heatmap starting at ZT12. Differential accessibility was determined using DESeq2.
b. Volcano plot of differentially accessible peaks shows 4,828 vs 2,270 open chromatin peaks in young vs. aged macrophages.
c. PCA plot of accessible chromatin peaks shows separation by age between groups.
d. Correlation matrix of Spearman correlation coefficients of chromatin accessibility between young and aged macrophages. Time is indicated by color code above the matrix, with ZT12 being white, and 4-hour intervals being represented by increasingly stronger tones of green.
e. Chromatin accessibility (as normalized and log2-transformed values) at gene loci with rhythmic expression in young mice is not altered in aged macrophages.
