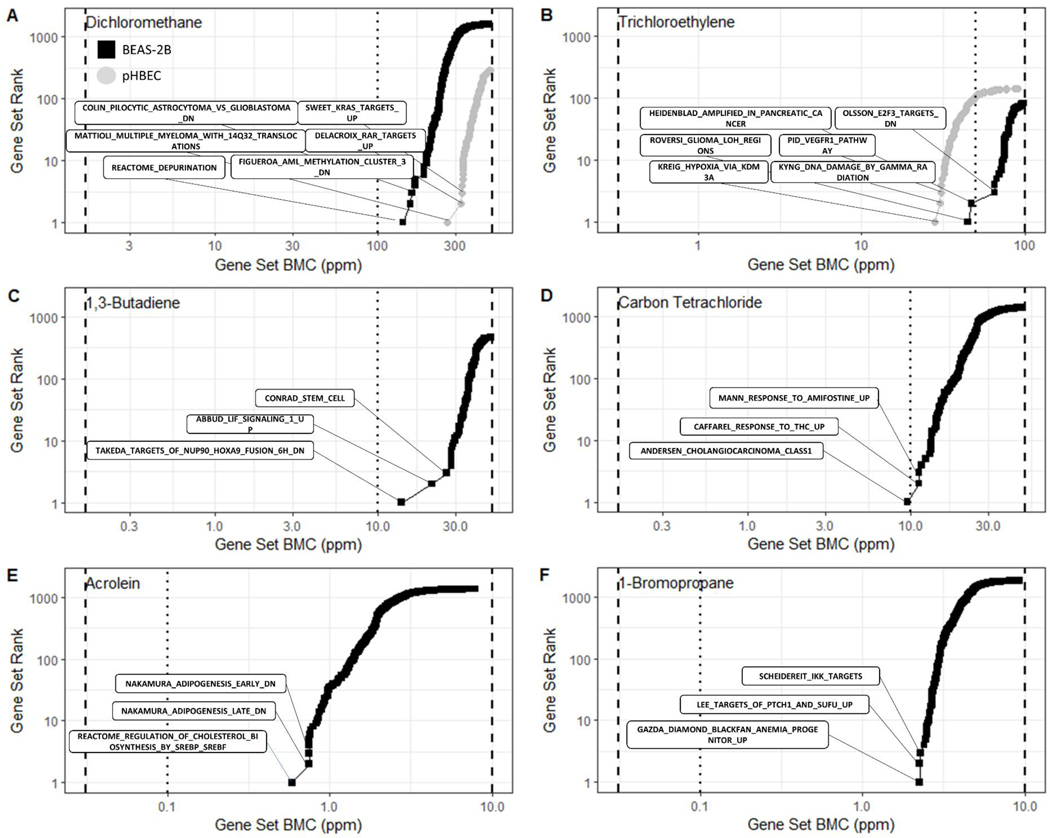
Figure 5.
Accumulation plots for the best BMD values for enriched gene sets for BEAS-2B cells (black squares) and pHBEC cells (grey circles). Each point represents the Median BMD for a gene set. Black dashed lines indicate the range of concentrations tested and the dotted line indicates the ACGIH TLV.

