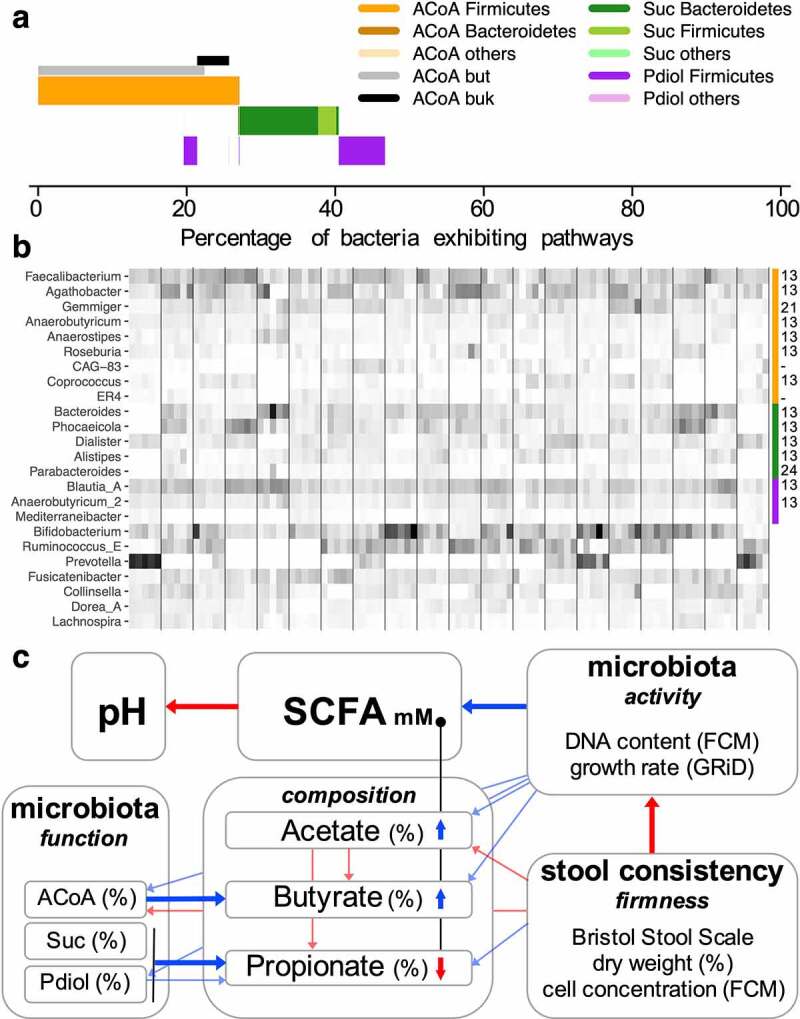
Figure 5.

Overview of pathway abundances and taxonomic composition of the in vivo experiment (20 subjects were sampled at five time-points over the period of 3 months). Panel a gives average abundances of pathways including taxonomic affiliations on the phylum level, whereas abundances of major genera comprising individual pathway communities (indicated by the color bar on the right) are given in panel b; abundances are relative to housekeeping genes of the total bacterial community. Literature references supporting pathway presence based on biochemical testing in members of individual taxa shown are given on the right (-: MAGs, no isolate available).13,21,24 In panel c, a mechanistic model of in vivo fecal SCFA concentrations based on individual parameters measured is given. Blue refers to positive correlations based on linear mixed-effect models that included subject as a random effect, whereas red depicts negative associations. Correlations that are considered most important are highlighted as thick arrows. For explanations, see text.
