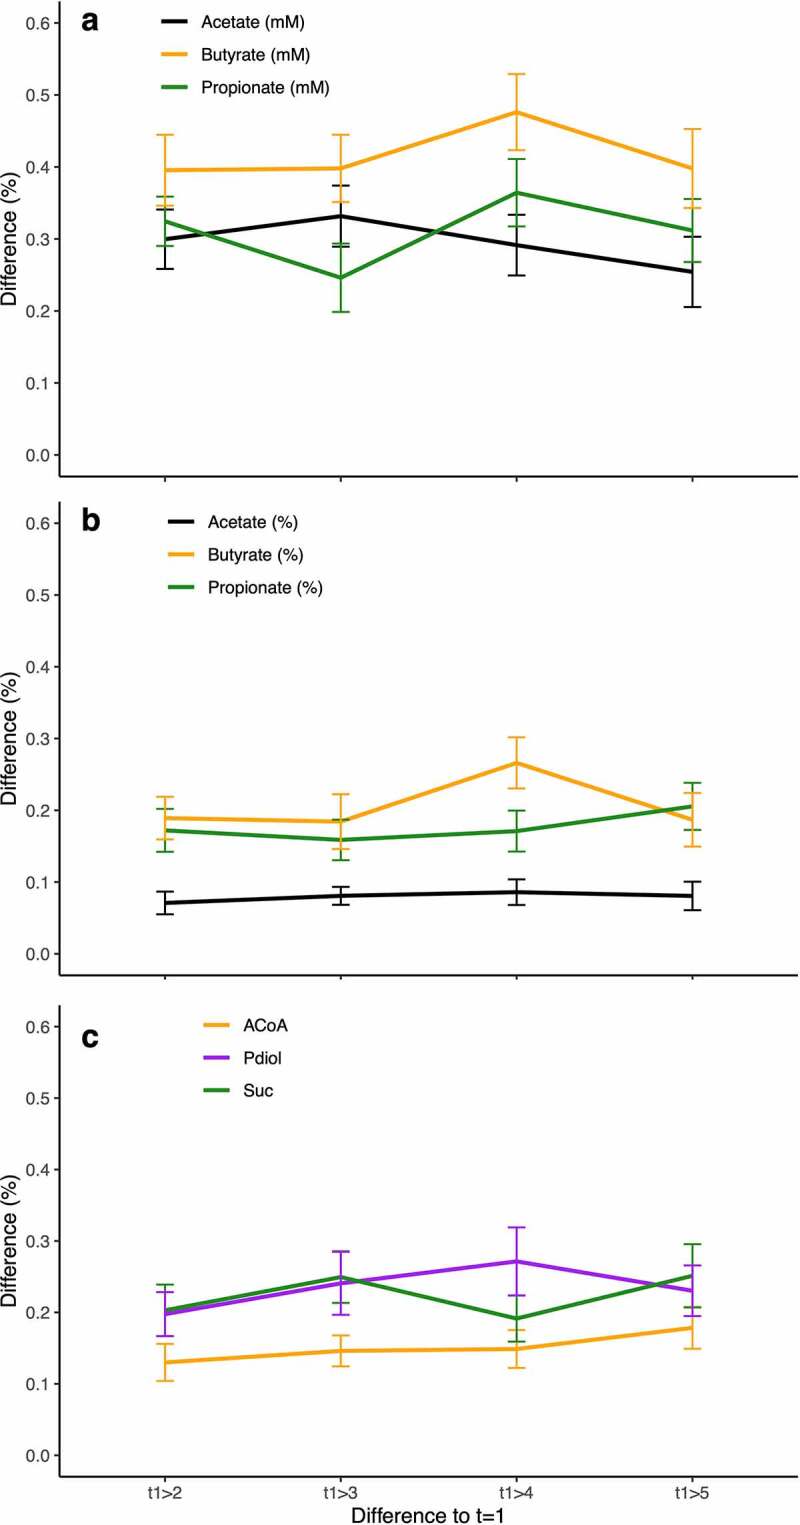
Figure 6.

Temporal stability of SCFA concentrations and pathway abundances in vivo. Subjects (n = 20) were sampled (n = 5) over a period of 3 months and results relative to the first time-point are shown. Panel a displays relative concentration changes of the SCFAs acetate, butyrate and propionate, whereas variations based on proportions (relative to total SCFA concentrations) and of abundances of bacteria exhibiting individual pathways are given in panels b and c, respectively.
