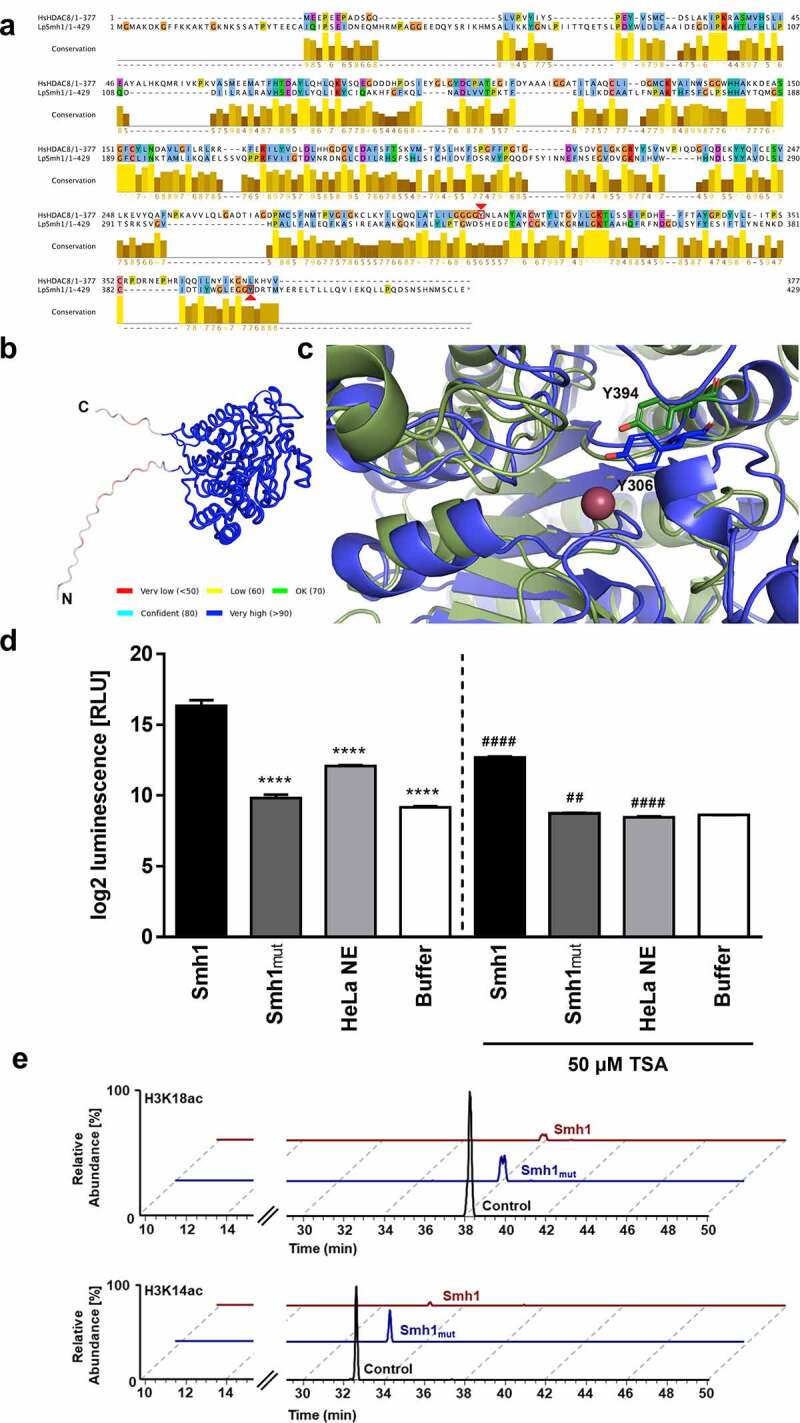
Figure 6.

Targeted mutation of Smh1 leads to reduced HDAC function (a) the amino acid sequence alignment of HDAC8 (1st row) and Smh1 (2nd row) is shown. The bar chart under the sequences represents the conservation in both enzymes, 10 representing maximal conservation. The overall enzyme identity is 12.78%. The red arrows indicate the respective catalytic tyrosine in HDAC8 and Smh1. (b) Structure prediction of Smh1 with signal peptide. The colour represents the confidence of the model; the colour key is given under the structure model. Except for the N- and C-termini, the confidence-value is higher than 90% which represents a model with a high accuracy. (c) Superposition of the catalytic core of both enzymes. In blue is shown the enzyme form human and in green the one of L. pneumophila with the respective catalytic tyrosine. The reddish dot represents the zinc ion that is necessary for the catalytic mechanism. (d) a chemical HDAC activity assay specific for class I and II HDACs was performed with recombinant purified Smh1 as well as a Smh1 mutant (Smh1mut) expressed in E. coli. HeLa Nuclear Extract (NE) was used as positive control and buffer without Smh1 as negative control. For inhibition of Smh1, the enzyme was incubated for 30 minutes with 50 µm Trichostatin a (TSA). One-way ANOVA was performed, and data are shown as mean + SEM of three experiments. **** p ≤ 0.0001 (compared to Smh1 without TSA); ## p ≤ 0.01; #### p ≤ 0.0001 (compared to the respective condition without TSA). (e) Calf thymus histones were treated with recombinant purified Smh1 or a mutated version (Smh1mut). Subsequently mass spectrometry was performed. Relative abundances (percentages) were calculated for H3K18 and H3K14 acetylation (H3K18ac and H3K14ac). Untreated histones were used as control.
