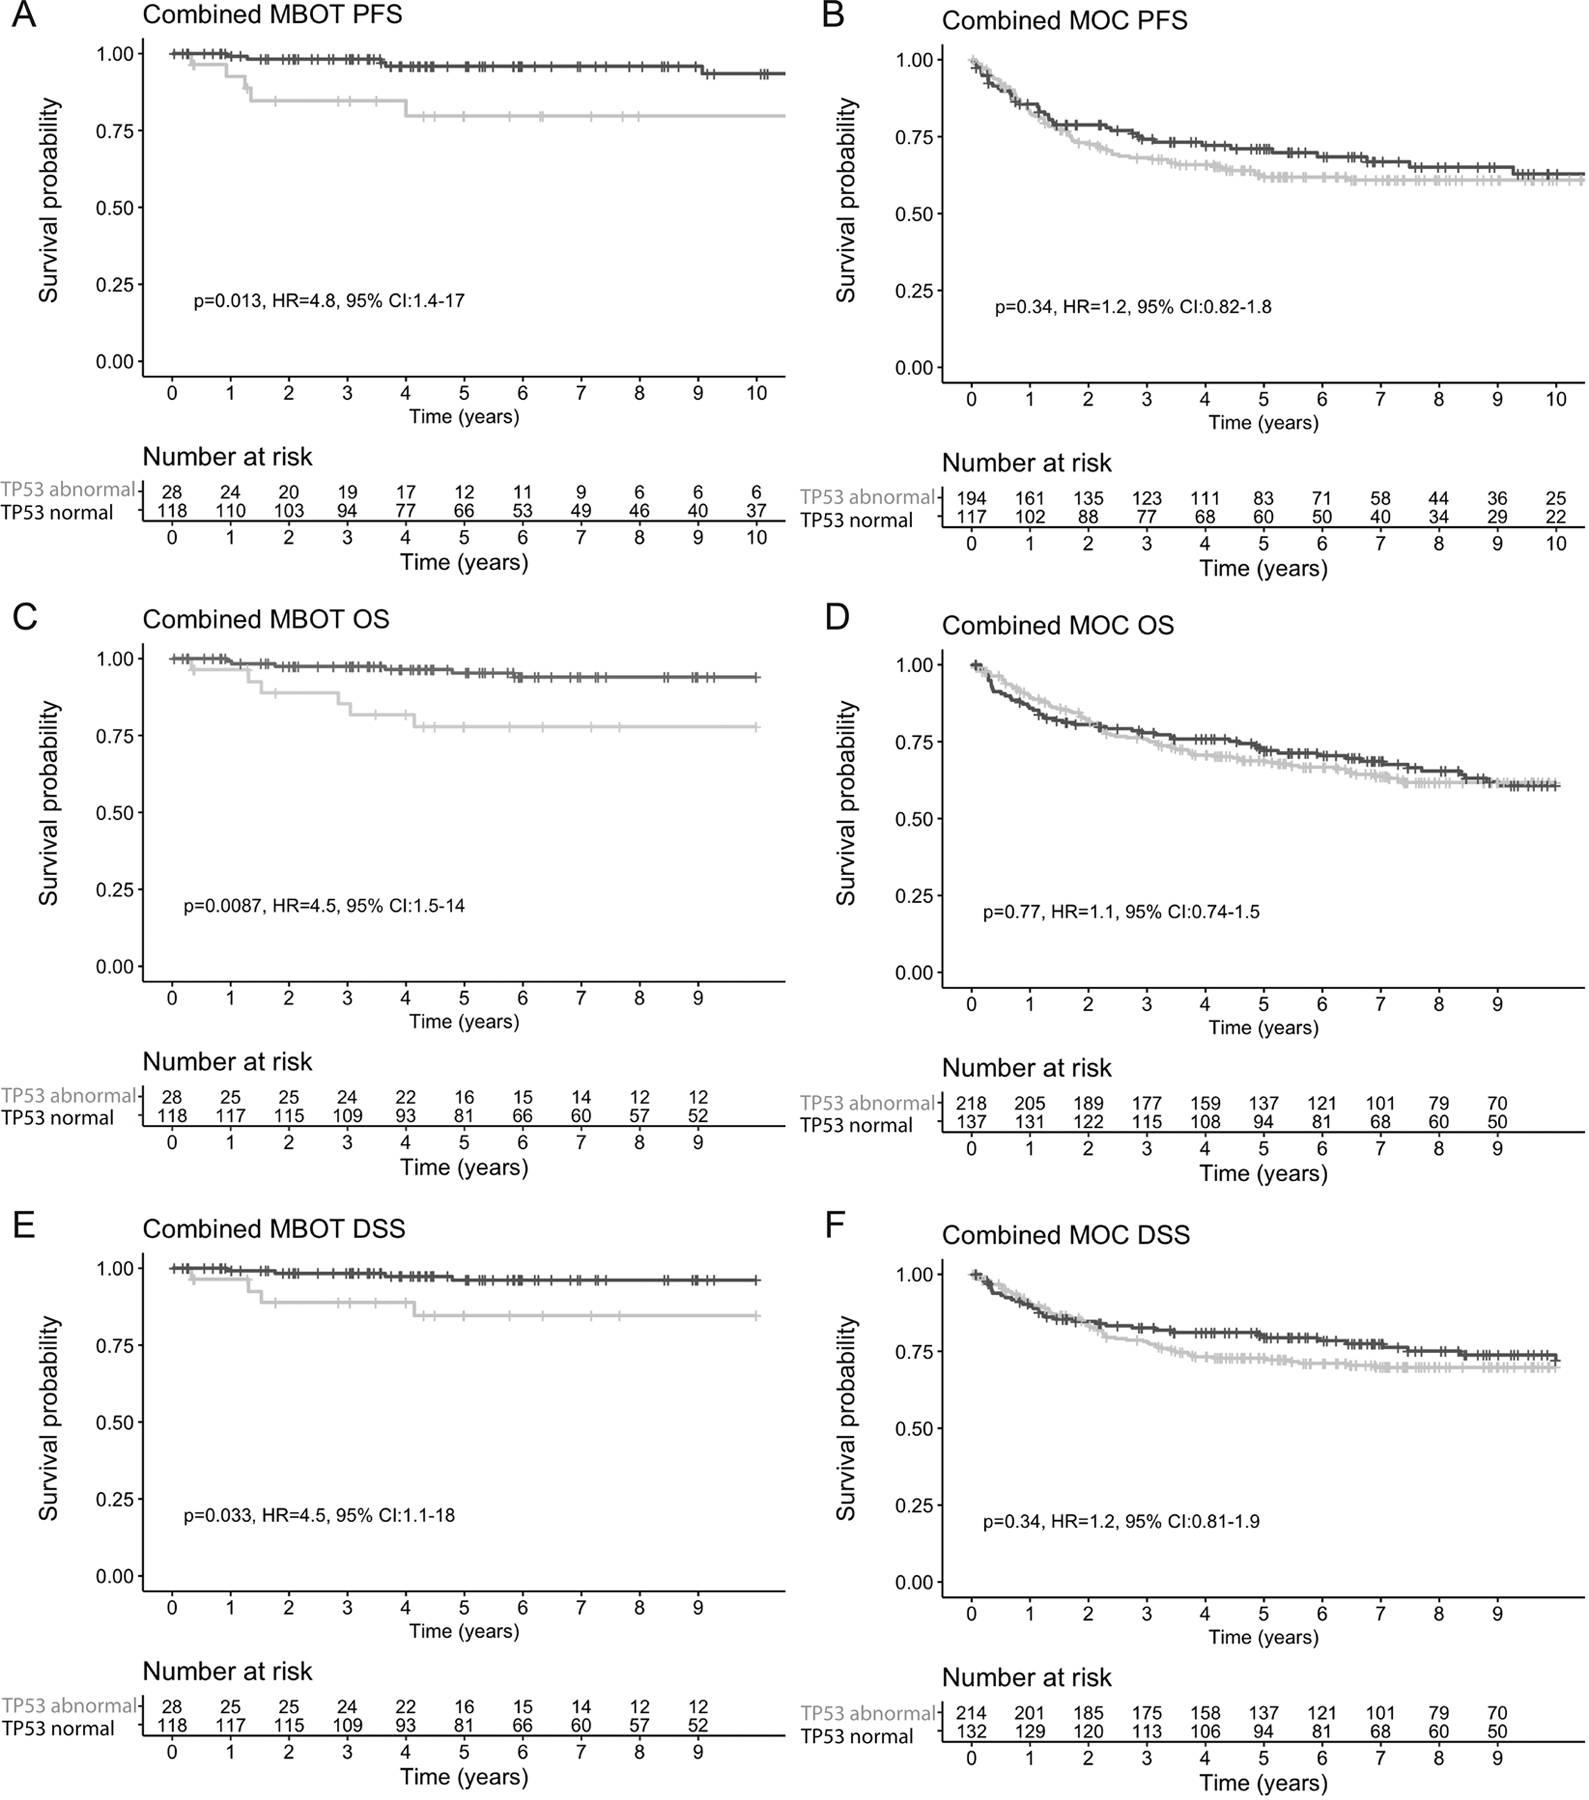
Figure 3. Kaplan-Meier survival plots of ovarian mucinous borderline tumors (MBOT) and mucinous carcinomas (MOC) stratified by TP53 status using mutation and immunohistochemistry data.

A, C, E. Progression-free (PFS; A), overall (OS; C), and disease-specific (DSS; E) survival in patients with MBOT. B, D, F. Progression-free (B), overall (D), and disease-specific (F) survival in patients with MOC.
