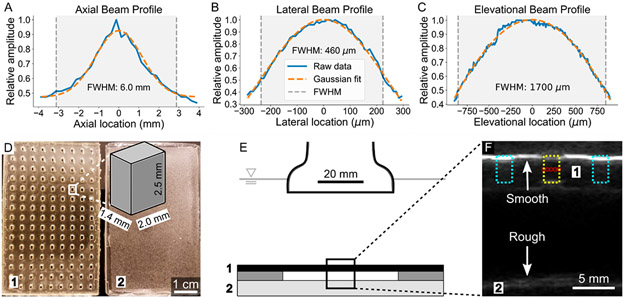
Figure 2.
Characterization of focused acoustic beam and depiction of experimental setup. (A–C) The profile of the FUS beam in the axial, lateral, and elevational axes is displayed. The relative amplitude is plotted against location, centered at the maximal amplitude location of the beam. The full width at half-maximum (fwhm), calculated using the raw data rather than the Gaussian fits, is shaded. (D) A top down view of the PDMS well construct used to hold the droplets (1) is shown alongside the PDMS scatterer/absorber used to prevent acoustic reflections from influencing droplet behavior (2). The dimensions of a single well are shown in the zoomed schematic; the full well is within the fwhm of the FUS beam when using 5 focal spots evenly spaced in the lateral axis. (E) A schematic of the ADV setup is shown. ADV/RC experiments were conducted in an acrylic tank filled with degassed water maintained at 37 °C. The PDMS well construct (1) was loaded with droplets, covered on both sides with an acoustically transparent membrane, and placed above the PDMS scatterer/absorber (2) using two additional PDMS spacers. This setup minimized the possibility of acoustic reflections interacting with droplets. (F) B-mode ultrasound was used to guide FUS pulses to the droplet containing wells. One such well is outlined in yellow (center) and the 5 evenly spaced (460 μm separation) focal spots for insonation are indicated with red circles. The adjacent wells (cyan) are filled with air and are easily distinguished due to their high echogenicity (i.e., brightness) at the surface. The minimization of acoustic reflections with a rough (2) as compared to smooth (1) PDMS surface is highlighted; the smooth surface appears much brighter than the rough surface.

