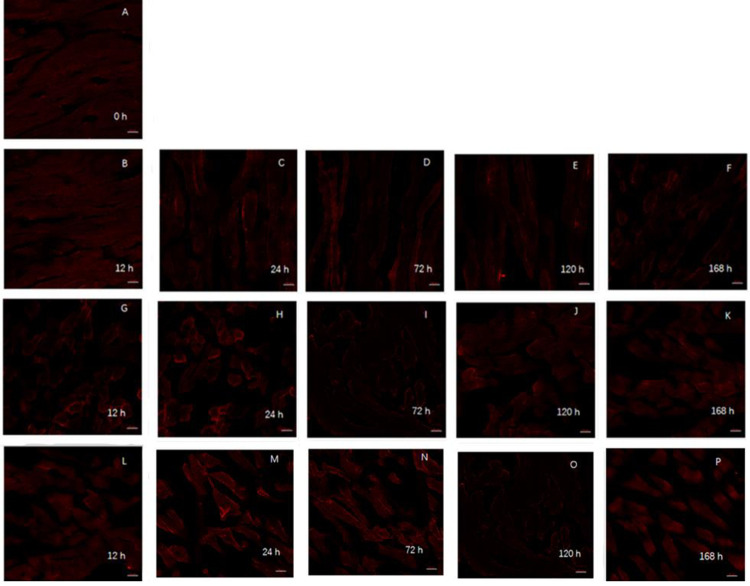
Fig 3. Observation of mitochondrial morphology distribution in yak muscle during postmortem maturation with laser confocal microscope.
PGC1-α are marked by PGC1-α (1:100) in red. A-F: at 0, 12, 24, 72, 120 and 168 h in the NAD+ treatment group; G-K: at 12, 24, 72, 120 and 168 h in the blank control group; L-P: at 12, 24, 72, 120 and 168 h in NADH treatment group.

