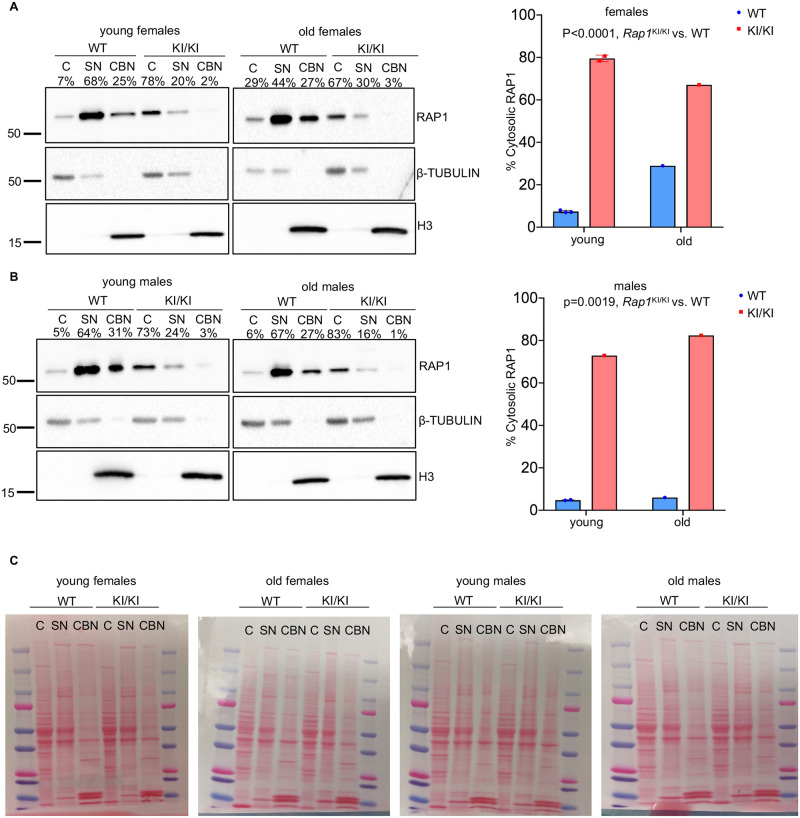
Fig 2. Cytosolic distribution of Rap1 is increased in Rap1 knockin brain tissues.
Western blot of cytosol (C), soluble nuclear (SN), and chromatin bound nuclear (CBN) fractions from whole brains of young and old female (A) and male (B) WT and Rap1KI/K mice probed with anti-RAP1, anti-β-TUBULIN (cytosolic protein), and anti-histone 3 (H3, nuclear protein). Quantifications of RAP1 cytosolic distributions (right) are shown in bar graphs. (C) Ponceau S stains of blots are displayed to clarify size differences of higher molecular weight (RAP1 and β-TUBULIN) compared to lower molecular weight bands (H3) in brain factions. n = 7 WT and n = 5 Rap1KI/KI mice. P values were determined by two-way ANOVAs. All data are mean ± SEM.

