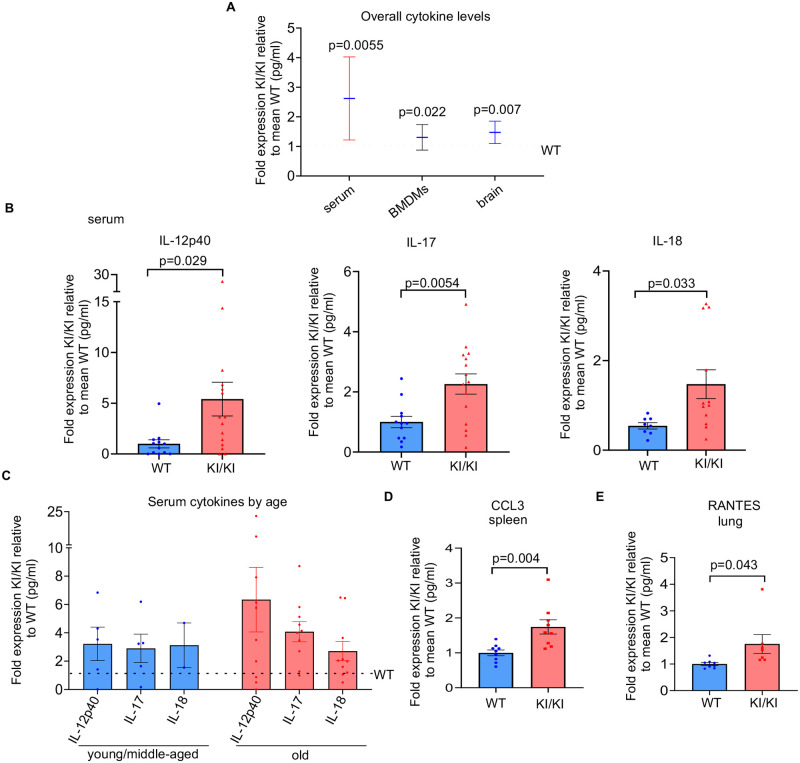
Fig 4. Expression of cytokines and chemokines are increased in Rap1 knockin serum, BMDMs, and tissues.
(A) The overall levels of cytokines and chemokines were significantly elevated in serum (n = 12 WT, 15 Rap1KI/KI mice), BMDMs (n = 3 per genotype), and brain tissues (n = 7 WT, 11 Rap1KI/KI mice) derived from Rap1KI/KI relative to WT as determine using multiplex cytokine analysis. P values were determined by a two-way ANOVA. (B) Individual cytokines including IL-12p40, IL-17, and IL-18 were elevated in serum from Rap1KI/KI. Graphs show the fold expression of cytokines derived from Rap1KI/KI relative to WT. P values were determined by student’s unpaired t-tests. (C) The fold expression of cytokines in Rap1KI/KI serum relative to WT serum from young/middle aged and old mice. (D-E) Individual cytokines/chemokines CCL3 in the spleen and RANTES in the lung (n = 9 mice per genotype) were elevated in Rap1KI/KI compared to WT tissues. P values were determined by student’s unpaired t-tests. Data are mean ± SEM in all graphs. WT was set to 1 in A-E with KI/KI values displayed as relative to the mean WT value for each graph.

