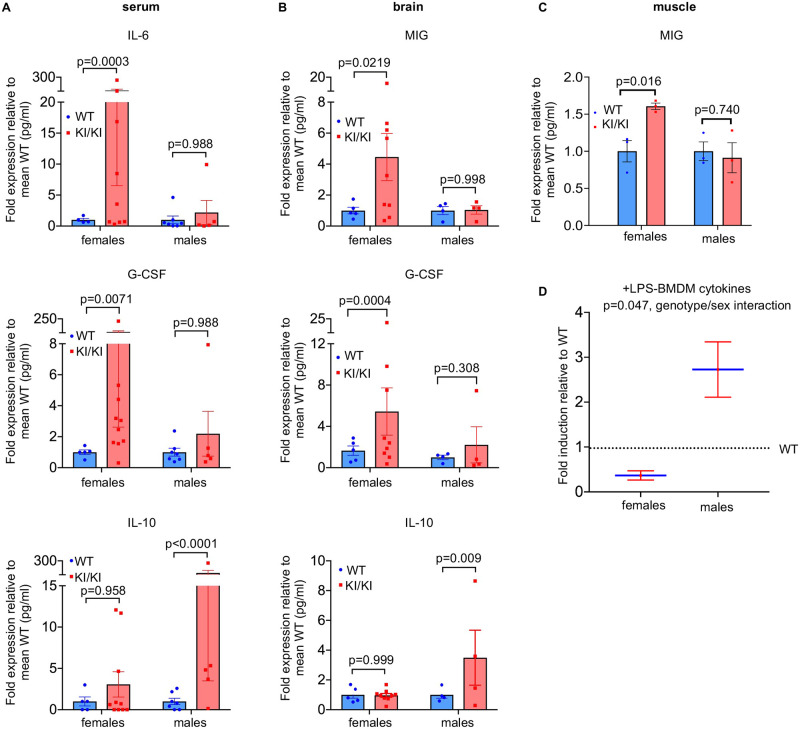
Fig 5. Rap1 knockin mice exhibit sex-dependent differences in immune responses.
(A) Bar graphs show the fold expression of cytokines in Rap1KI/KI relative to WT serum (n = 5 WT females, 10 KI/KI females, 7 WT males, 5 KI/KI males). IL-6 (top) and G-CSF (middle) were significantly increased in Rap1KI/KI females only, whereas IL-10 (bottom) was significantly increased in Rap1KI/KI males only. P values were determined by two-way ANOVAs with Tukey’s multiple comparisons. (B) Bar graphs show the fold expression of cytokines in Rap1KI/KI relative to WT brains (n = 5 WT females, 9 KI/KI females, 4 WT males, 4 KI/KI males). MIG (top) and G-CSF (middle) were significantly higher in Rap1KI/KI females only, whereas IL-10 (bottom) shows increased expression in Rap1KI/KI males only. P values were determined by two-way ANOVAs with Tukey’s multiple comparisons. (C) Bar graph shows the fold expression of MIG in Rap1KI/KI relative to WT muscles (n = 3 WT females, 3 KI/KI females, 3 WT males, and 3 KI/KI males). MIG was significantly higher in Rap1KI/KI females only. (D) Graph shows the expression of LPS (200 ng/ml for 24 hr)- induced cytokines/chemokines in BMDMs derived from Rap1KI/KI relative to WT females and males. P values were determined by two-way ANOVAs with Sidak’s multiple comparisons. Data are mean ± SEM.

