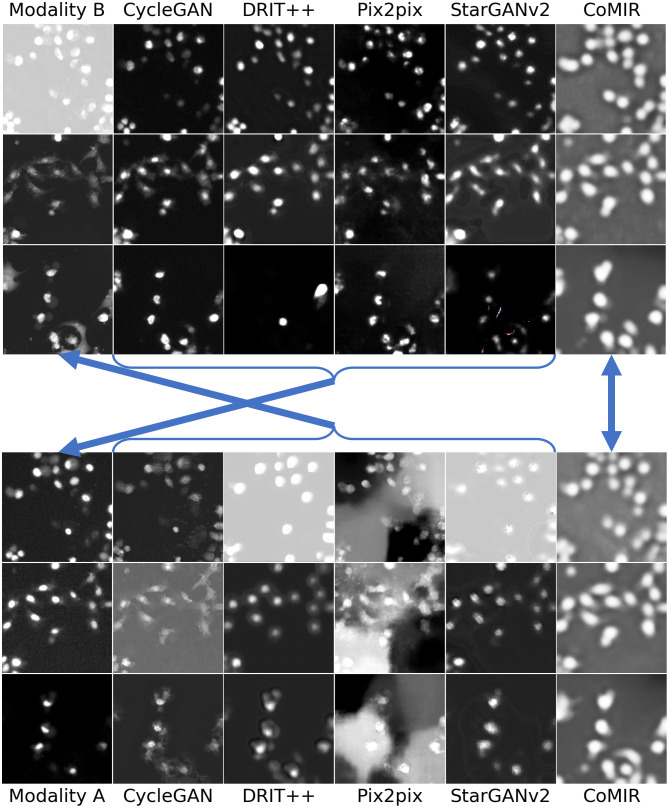
Fig 5. Modality-translated image samples of the Cytological dataset by different evaluated methods (contrast-enhanced for visualisation).
Each row shows the results on one random image from each fold. Images in Columns 2–6 are generated from the images in (the corresponding row of) Column 1. Top block: Translations generated from Modality B. Bottom block: Translations generated from Modality A. The arrows indicate what to compare for visual inspection of the level of achieved similarity (pointing from generated images to the corresponding target of the learning process).

