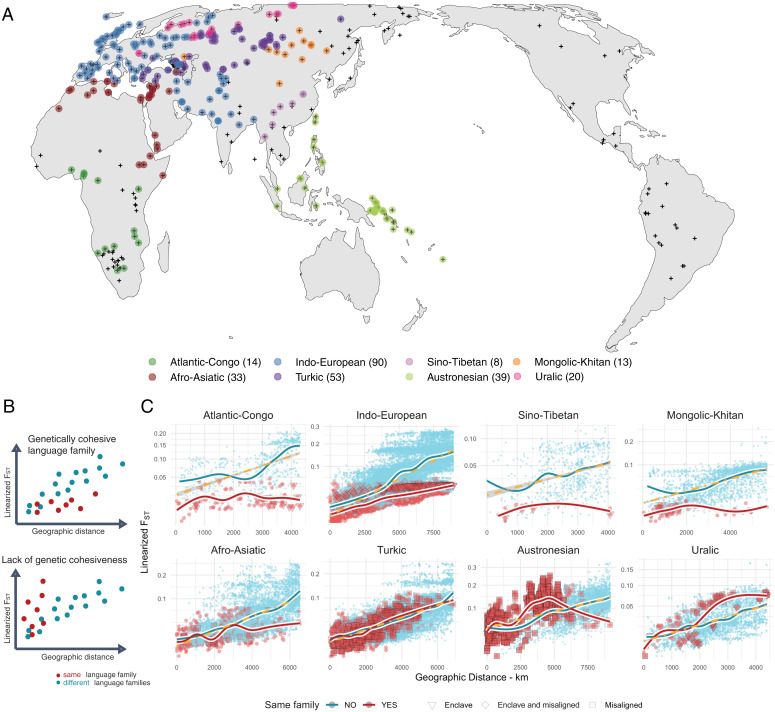
Fig. 2.
Language family comparisons. (A) Approximate location of all the population genetic samples (little black crosses). Target language families are color coded with a solid circle. In the legend, the numbers in parenthesis correspond to the number of population samples for each language family. (B) Schematic representation of language family profiles, which are genetically cohesive over geographic distance (match) or which are not genetically cohesive (mismatch). (C) Correspondence between genetic distances and geographic distances for eight major language families. In the Top Row, language families are mostly genetically cohesive; in the Bottom Row, language families show an ambiguous profile. Small blue circles: between-family pairs; large red circles: within-family pairs. Smooth regressions summarize the between- and within-family trends. Different symbols in the same-family comparisons correspond to pairs with populations identified as mismatches, with the heuristics illustrated in Fig. 1 (enclaves and/or misalignments). Yellow dashed line: IBD linear regression between geographic and genetic distances.

