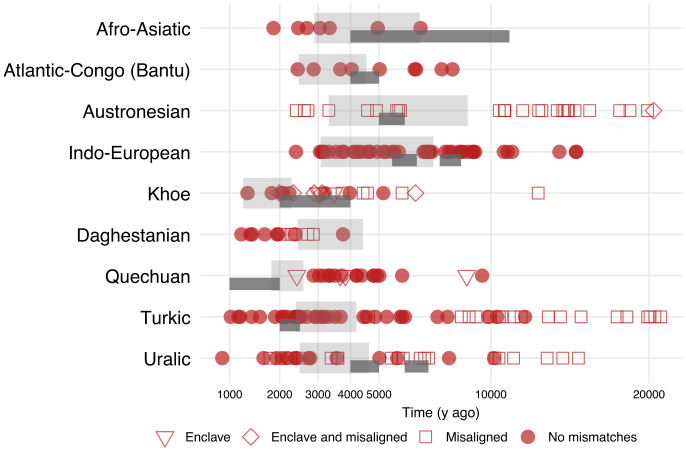
Fig. 3.
Pairwise divergence time within families or major subgroups. Each point corresponds to the genetic divergent times of population pairs which share a most recent common ancestor at the root level of the language family. Solid circles exclude populations flagged as mismatches. Other symbols indicate pairs which include one type of mismatch (enclave and/or misalignment), following the same conventions as in Fig. 2. Two methods to reconstruct the divergence time of each language family are shown. Light gray blocks correspond to the 95% credible intervals of divergence time reconstructed by generalized Bayesian dating (33). Darker lines below the gray blocks show proposed divergence times from archaeological and historical reconstructions, with indicative time boundaries. Note that such reconstructions are not available for all language families, and, in some cases, two historical reconstructions have been suggested for the same family (see Materials and Methods and SI Appendix, SI Text for references).

