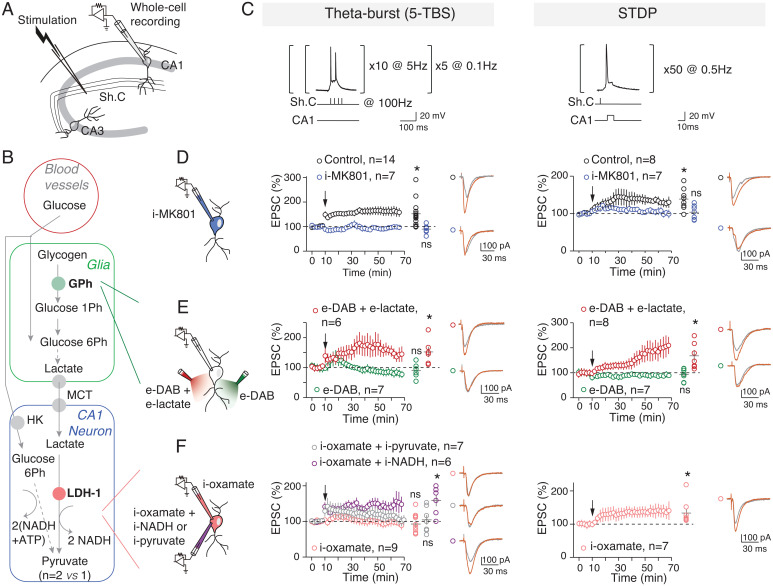
Fig. 1.
5-TBS–LTP and STDP-LTP rely differently on neuronal lactate. (A) Experimental setup. Sh. C, Schaffer collaterals. (B) Key steps of glucose transport and glia–neuron lactate transport: glycogen catalysis into glucose-1-phosphate via glycogen phosphorylase, lactate entry in neurons via monocarboxylate transporters (MCTs), and lactate conversion to pyruvate by LDH; Ph, phosphate. (C) 5-TBS (with nested high-frequency, 100-Hz stimulations within slower-frequency, 5-Hz stimulations repeated five times at 0.1 Hz) and STDP (50 paired pre/post stimulations at 0.5 Hz) paradigms. (D–G) Averaged time-course of the synaptic weight with EPSC amplitude 50–60 min after TBS or STDP paradigm. (D) 5-TBS–LTP and STDP-LTP (5-TBS–LTP: P = 0056, n = 14; STDP-LTP: P = 0.0070, n = 8) were NMDAR mediated (with intracellular application of i-MK801: 5-TBS, P = 0.1562, n = 7; STDP, P = 0.6484, n = 7). (E) Inhibition of glycogen phosphorylase with bath-applied DAB (e-DAB) prevented 5-TBS–LTP and STDP-LTP (with e-DAB: 5-TBS, P = 0.3691, n = 6; STDP, P = 0.4213, n = 7). Coapplication of DAB and lactate allowed 5-TBS–LTP and STDP-LTP (P = 0.0311, n = 6 and P = 0.0383, n = 7, respectively). LTP rescued with e-lactate was not significantly different from control (5-TBS-LTP: P = 0.6735; STDP-LTP: P = 0.4155). (F) Intracellular inhibition of LDH revealed distinct effects on 5-TBS and STDP expression because i-oxamate prevented 5-TBS–LTP (P = 0.4600, n = 9) but not STDP-LTP (P = 0.0398, n = 7). 5-TBS–LTP was rescued with coapplication of i-oxamate and i-NADH (P = 0.0145, n = 6 versus 5-TBS–LTP control: P = 0.7995) but not i-pyruvate (P = 0.7548, n = 7). Representative traces show 15 EPSCs averaged during baseline (gray) and 45 min (red) after protocols (arrows). All data are shown as mean ± SEM; *, P < 0.05; ns, not significant by two tailed t test. See SI Appendix, Table S1, for detailed data and statistics.

