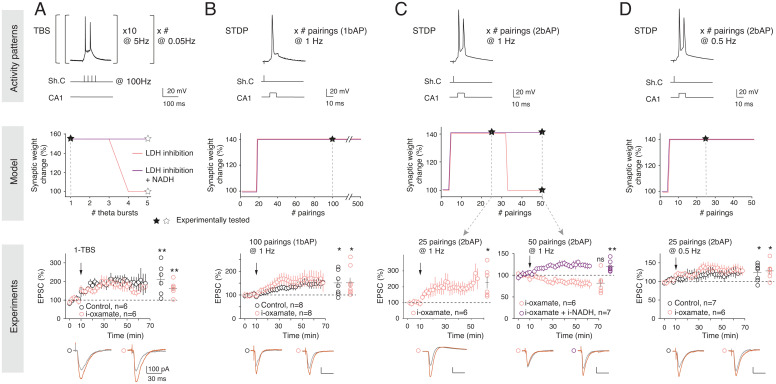
Fig. 3.
Dependence on lactate for LTP expression is activity pattern linked. (A) Lactate-dependent TBS-LTP depends on the number of TBS (Left, protocol). The model predicts that TBS-LTP is dependent on the lactate pathway from 4-TBS, as demonstrated experimentally with LTP induced by 1-TBS (P = 0.0229, n = 6), which was not impaired by i-oxamate (P = 0.0109, n = 6). (B) STDP-LTP induced by 20 to 500 pre/post pairings at 1 Hz with a single bAP/pairing can be induced under LDH inhibition as predicted by the model and demonstrated experimentally with LTP induced by 100 pairings at 1 Hz under control (P = 0.0191, n = 8) or LDH inhibition (P = 0.0391, n = 8) conditions, with similar magnitude (P = 0.9836). (C) STDP-LTP induced by pairings at 1 Hz with two bAPs/pairing is dependent on LDH activity from 30 pairings, as predicted by the model and demonstrated experimentally with i-oxamate, which prevented LTP expression by 50 (P = 0.0956, n = 6), but not 25 (P = 0.0216, n = 6), pairings with two bAPs. Intracellular coapplication of i-oxamate and i-NADH rescued STDP-LTP (P = 0.0061, n = 7), as predicted by the model. (D) STDP-LTP induced by pairings at 0.5 Hz with two bAPs/pairing (P = 0.0369, n = 7) can be induced under LDH inhibition (P = 0.0309, n = 6), as predicted by the model and demonstrated experimentally with LTP induced by 25 pairings with two bAPs/pairing, which is not impaired with i-oxamate. Black stars indicate the experimental conditions tested. Representative traces show 15 EPSCs averaged during baseline (gray) and 45 min (red) after protocol (arrows). All data are represented as mean ± SEM; *, P < 0.05; ns, not significant by two tailed t test. See SI Appendix, Table S3 for detailed data and statistics.

