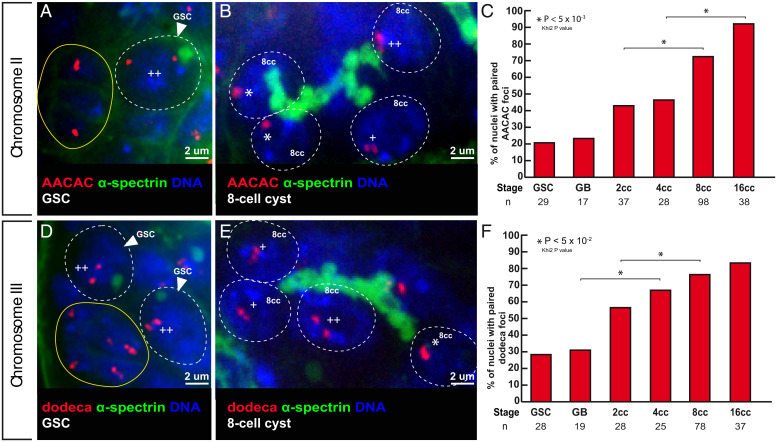
Fig. 2.
Centromeres of chromosomes II and III become associated in the mitotic region. (A and B) Confocal Z-section projections of wild-type testes stained for chromosome II centromeres probe (AACAC, red), fusome (α-spectrin, green), and DNA (DAPI, blue). (A) GSC shows two foci separated by a distance >0.7 µm (++), thus unpaired; hub is marked in yellow. (B) The 8-cell cyst shows two nuclei with one focus (*), thus centromeres are paired and one nucleus with two foci (++) separated by a distance >0.7 µm and thus unpaired. (C) Graphs plot the percentage of paired chromosome II centromeres for each developmental stage in the mitotic region using the AACA probe. The number of cells analyzed is indicated under each stage.*P < 0.05 (khi2 test comparing 2cc with 8cc and 4cc with 16cc). (D and E) Confocal Z-section projections of wild-type testes stained for chromosome III centromere probe (dodeca, red), fusome (α-spectrin, green), and DNA (DAPI, blue). (D) Two GSCs with two foci separated by >0.7 mm (++), thus unpaired; hub is marked in yellow. (E) The 8-cell cyst shows a nucleus with one foci (*), thus paired; two nuclei with two foci (+) separated by a distance of ≤0.7 µm, thus paired; and one nucleus with two foci (++) separated by a distance of 0.7 µm, thus unpaired. (F) Graph plots percentage of paired chromosome III centromeres for each developmental stage in the mitotic region using the dodeca probe. The number of cells analyzed is indicated below each stage. In A, B, D, and E, dotted lines surround germ cell nuclei. (Scale bars, 2 µm.) *P < 0.005 (khi2 test comparing GB with 4cc and 2cc with 8cc).

