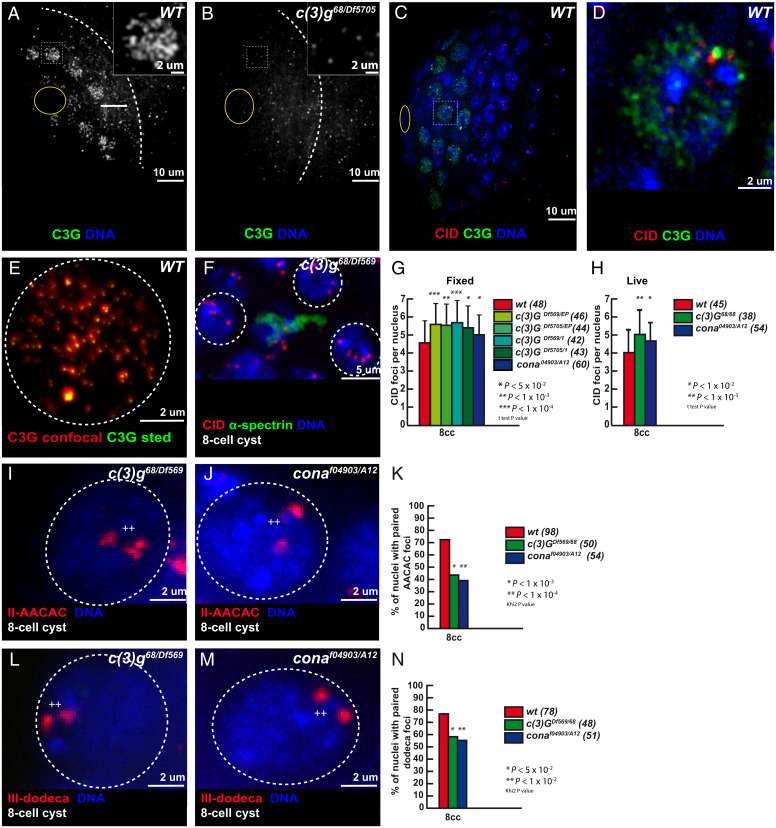
Fig. 3.
The synaptonemal complex component C(3)G is present in the mitotic region and promotes centromere association. (A and B) Confocal Z-section projections of wild-type (A) and c(3)G68/Df5705 (B) testes stained for C(3)G (green) and (DAPI, blue). Dotted white lines delimit the mitotic region; hub is marked by the yellow circle. (C and D) Confocal Z-section projections of wild-type testes stained for centromeres (CID, red), C(3)G (green), and DNA (blue); hub is marked by a yellow circle. Insets in A and B show magnified nuclei corresponding to outlined nuclei. Outlined nucleus is magnified in D. (Scale bars in A and B, 10 µm; Insets, 2 µm.) (E) Z-section projection acquired using Stimulated Emission Depletion Microscopy (STED) microscopy of a wild-type (WT) 2-cell cyst stained for C(3)G (red is confocal, green is STED). (Scale bar, 2 µm.) (F) Confocal Z-section projection of an eight-cell cyst from c(3)G68/Df(3R)BSC569 stained for centromere (CID, red), fusome (α-spectrin, green), and DNA (DAPI, blue). Three nuclei (dotted circles) show unpaired centromeres. (Scale bar, 5 µm.) (G and H) Graphs plot the number of CID foci of eight-cell cysts in fixed wild-type, Df(3R)BSC569/c(3)GEP, Df5705/c(3)GEP, Df(3R)BSC569/c(3)G1, Df5705/c(3)G1, and conaA12/cona04973 (G) and in live wild-type, c(3)G68/c(3)G68 and conaA12/cona04973 (H) testes. The number of analyzed cells is indicated next to each genotype. *P < 0.01, **P < 0.001, ***P < 0.0001, (two-tailed Student’s t test). (I and J) Confocal Z-section projections of c(3)G68/Df(3R)BSC569 (I) and conaA12/cona04973. (J) Eight-cell cyst nuclei stained for AACAC (red) and DNA. In both cases, nuclei (dotted circles) show two foci separated by >0.7 mm (++) indicating unpaired centromeres. (K) Graph plots the percentage of paired chromosomes III in eight-cell cysts using the AACAC probe in wild-type, c(3)G68/Df(3R)BSC569, and conaA12/cona04973 fixed testis. The number of analyzed cells is indicated next to each genotype. *P < 0.05, **P < 0.01 (khi2 test). (L and M) Confocal Z-section projections of c(3)G68/Df(3R)BSC569 (L) and conaA12/cona04973. (M) Eight-cell cyst nuclei stained for dodeca (red) and DNA. Both nuclei (dotted circles) show two foci separated by >0.7 µm (++), indicating unpaired centromeres. (Scale bars in I, J, L, and M, 2 µm.) (N) Graph plots the percentage of paired chromosome II in eight-cell cysts using the dodeca probe in wild-type, c(3)G68/Df(3R)BSC569, and conaA12/cona04973 fixed testes. The number of analyzed cells (n) is indicated next to each genotype. *P < 0.001, **P < 0.0001 (khi2 test). Chromosome II and III centromeres are considered paired when the distance between two foci is ≤0.7 µm.

