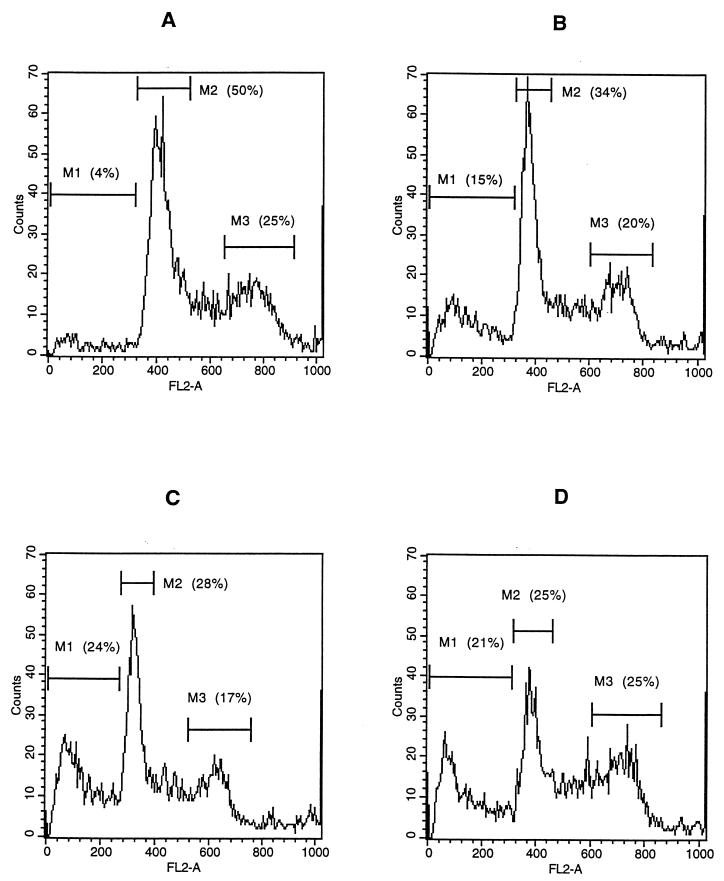
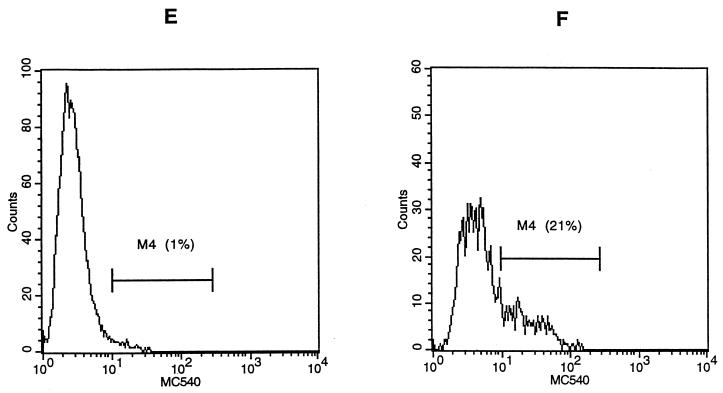
FIG. 4.
Flow cytometric analysis of H. ducreyi-induced apoptosis of Jurkat T cells. The cells were stained with PI after incubation in medium (A) or in medium containing 10 μg of FTWC per ml for 2 (B), 4 (C), or 6 (D) h. Cells were stained with MC540 after incubation in medium (E) or in medium containing 10 μg of FTWC per ml for 24 h (F). M1, cells with hypodiploid nuclei; M2, cells in the G1 phase; M3, cells in the G2/M phase; M4, region of positive MC540 fluorescence. FL2-A, area of DNA fluorescence. The results are representative of at least four independent experiments; approximately 10,000 live cells were analyzed per experiment.


