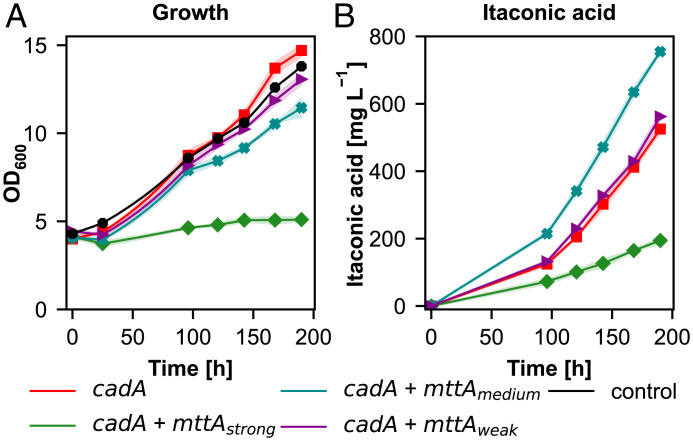
Fig. 2.
Fine-tuning the balance of expression of cadA and mttA increases itaconic acid production. (A) Growth profiles, (B) itaconic acid production profiles of the itaconic acid producing strain and the control. Time axis corresponds to the production phase under autotrophic conditions. At least three biological replicates were used in the screening to monitor the producing strains. Shades represent the SDs (±).

