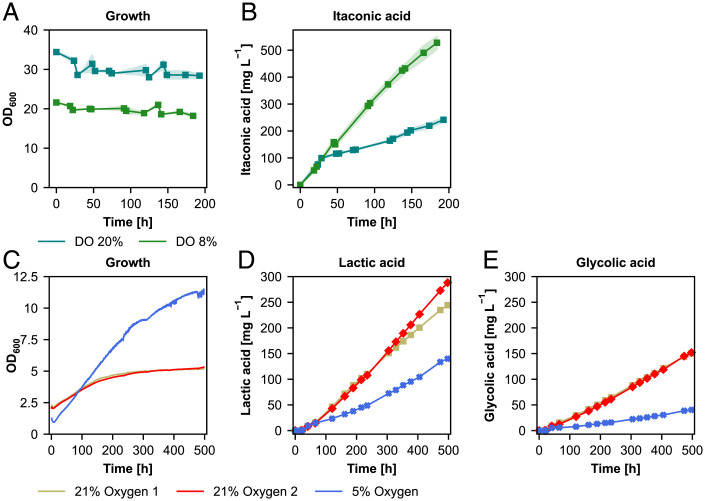
Fig. 7.
Bioreactor cultivations show each process should be designed based on the specific requirements of the target product. (A) Growth and (B) itaconic acid production profile at constant DO concentrations 8% and 20%. (C) Growth, (D) lactic, and (E) glycolic acid production profile at 21% and 5% inlet oxygen concentrations. Time axis corresponds to the production phase under autotrophic conditions. Bioreactor cultivations for itaconic acid production were done in duplicates and shades represent the SD (±). For lactic acid results of each fermentation run are shown separately.

