Fig. 2.
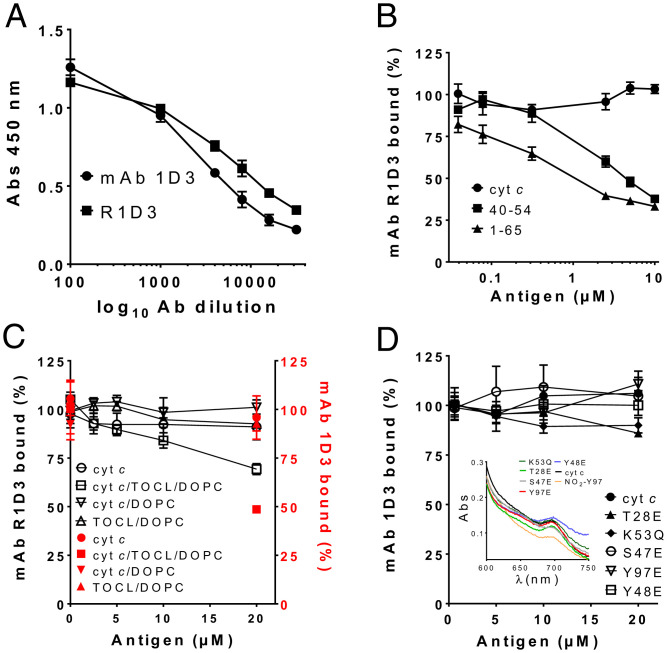
Immunochemical characterization of mAb 1D3 and R1D3 binding. (A) Binding analysis of mAb 1D3 and R1D3 antibodies. Binding of mAb 1D3 (circles) and R1D3 (squares) to adsorbed cyt c (0.5 µM) using different antibody dilutions (1:500–1:30,000 in PBS-Tween) was assayed by indirect ELISA. Plates were developed with OPD and absorbance at 450 nm recorded. (B) Binding of R1D3 (0.18 ng/µL) was evaluated in the presence of soluble native cyt c (circles), 40–54 peptide (squares), and 1–65 cyt c peptide (triangles) (0–10 µM) by competitive ELISA. Results are expressed as % of bound antibody. (C) The binding of mAb 1D3 (black squares) and R1D3 (red circles) (0.18 ng/µL) to phosphatidylcholine liposomes (DOPC) or phosphatidylcholine and cardiolipin liposomes (TOCL/DOPC) with or without native cyt c (200 µM) was analyzed by competitive ELISA as for B. (D) Competitive ELISA was performed as in B in the presence or absence of soluble recombinant native cyt c and the mutants: Y48E, T28E, Y97E, K53Q, and S47E (0–20 µM). Plates were developed with OPD and absorbance recorded at 450 nm. Results are expressed as % of bound antibody. Inset: spectroscopic analysis of cyt c and the different cyt c mimetics showing the peak of absorbance at 695 nm, indicating the presence of M80–Fe bond. NO2Y97 is included as an oxidatively modified cyt c with disrupted heme-M80 ligation (28).

