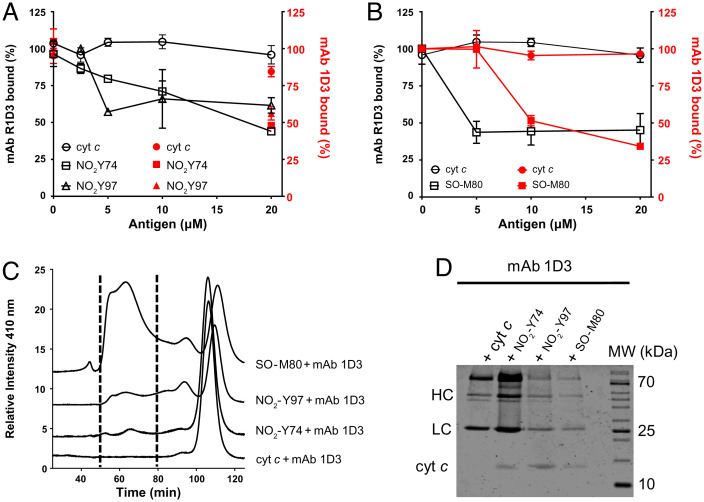
Fig. 3.
Binding of mAb 1D3/R1D3 antibodies to alternative conformations of oxidized cyt c species. (A) Competitive ELISA was performed adsorbing native cyt c (0.5 µM) to the assay plate and the mAb R1D3 (black symbols) or the mAb R1D3 (red symbols) (0.18 ng/µL) allowed to bind in the presence or absence of soluble native cyt c, NO2Y74, and NO2Y97 cyt c (0–20 µM). (B) Binding of mAb R1D3 (black lines) and R1D3 (red lines) to native and SO-M80 cyt c (0–20 µM). Plates were developed with OPD and absorbance recorded at 450 nm. Results are expressed as % of bound antibody. (C) Following incubation of mAb 1D3 with native cyt c, NO2Y74, NO2Y97, and SO-M80 cyt c, the immune complexes were separated by size exclusion chromatography and monitored at 410 nm. Fractions containing the complexes (between dotted lines, 50–80 min) were collected. (D) SDS–PAGE (15%) and Coomassie Blue staining of the proteins eluted during the size exclusion chromatography (fractions between 50 and 80 min). MW: molecular weight marker. Arrows indicate H (HC) and L chains (LC) of mAb 1D3 and cyt c.

