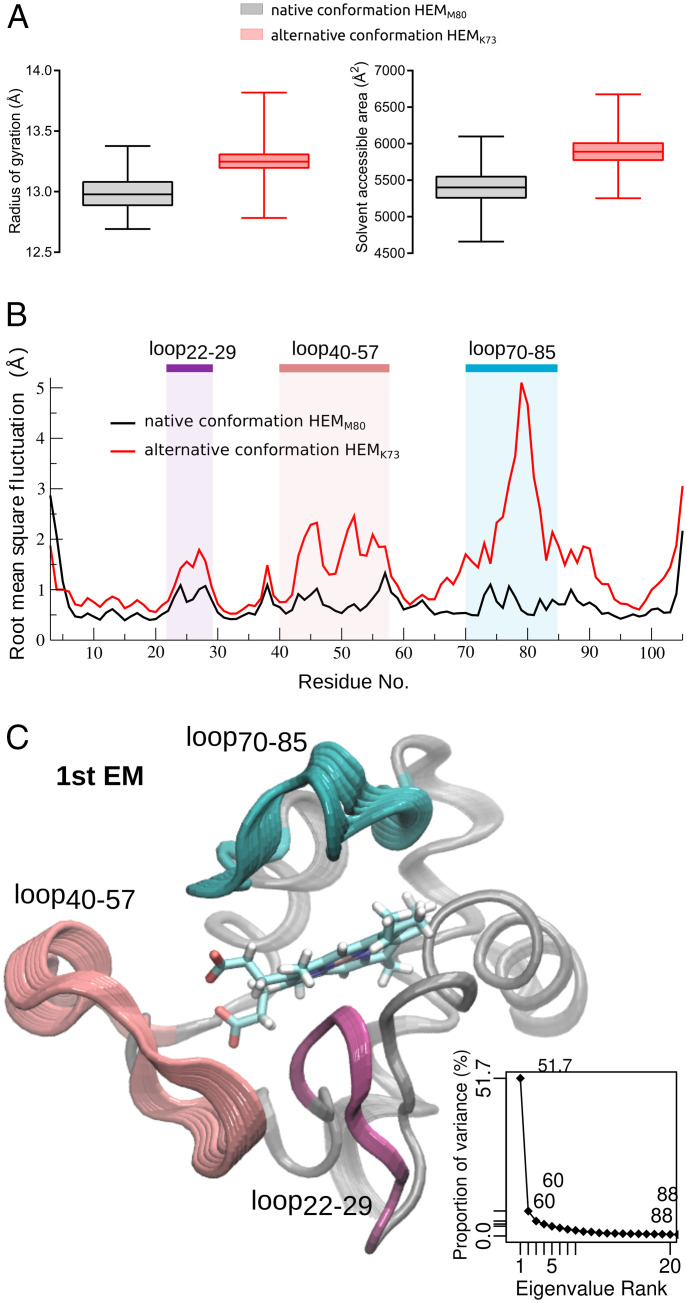
Fig. 4.
Comparative dynamic behavior of cyt c in native and alternative conformations. (A) Protein radius of gyration (Å) (Left) and total solvent accessible surface area (Å2) (Right), calculated from the MD simulations of native conformation HEMM80 (black) and alternative conformation HEMK73 (red). (B) Protein backbone rms fluctuation (Å) in a pair residue basis shows the regions that present differential flexibility, which are highlighted. (C) Essential dynamics analysis. Cartoon representation of first essential mode (1st EM). Regions are colored as in B. Inset: accumulated proportion of variance explained by essential mode rank.

