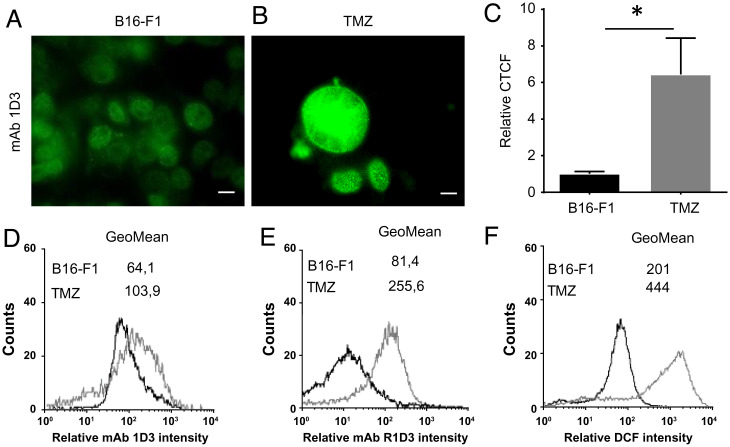
Fig. 8.
Detection of an alternative conformation of cyt c in a senescent cell model. (A and B) mAb 1D3 staining. B16-F1 (control, DMSO-treated) (A) or TMZ-treated cells (B) were probed with the mAb 1D3 following antimouse-FITC–conjugated antibody (green) and analyzed by confocal microscopy. Horizontal scale bars indicate 10 µm. (C) CTCF is shown as fold change in fluorescence levels compared with control. Differences shown with an asterisk (*) were statistically significant, with P < 0.05. (D) Flow cytometry analysis of the mAb 1D3 bound to control (black histogram) or senescent cells (gray histogram). (E) Flow cytometry analysis of the R1D3 bound to control (black histogram) or senescent cells (gray histogram). (F) Flow cytometry analysis of reactive species generated in control (B16-F1, black histogram) or senescent cells (gray histogram) detected by the increase in DCF.

