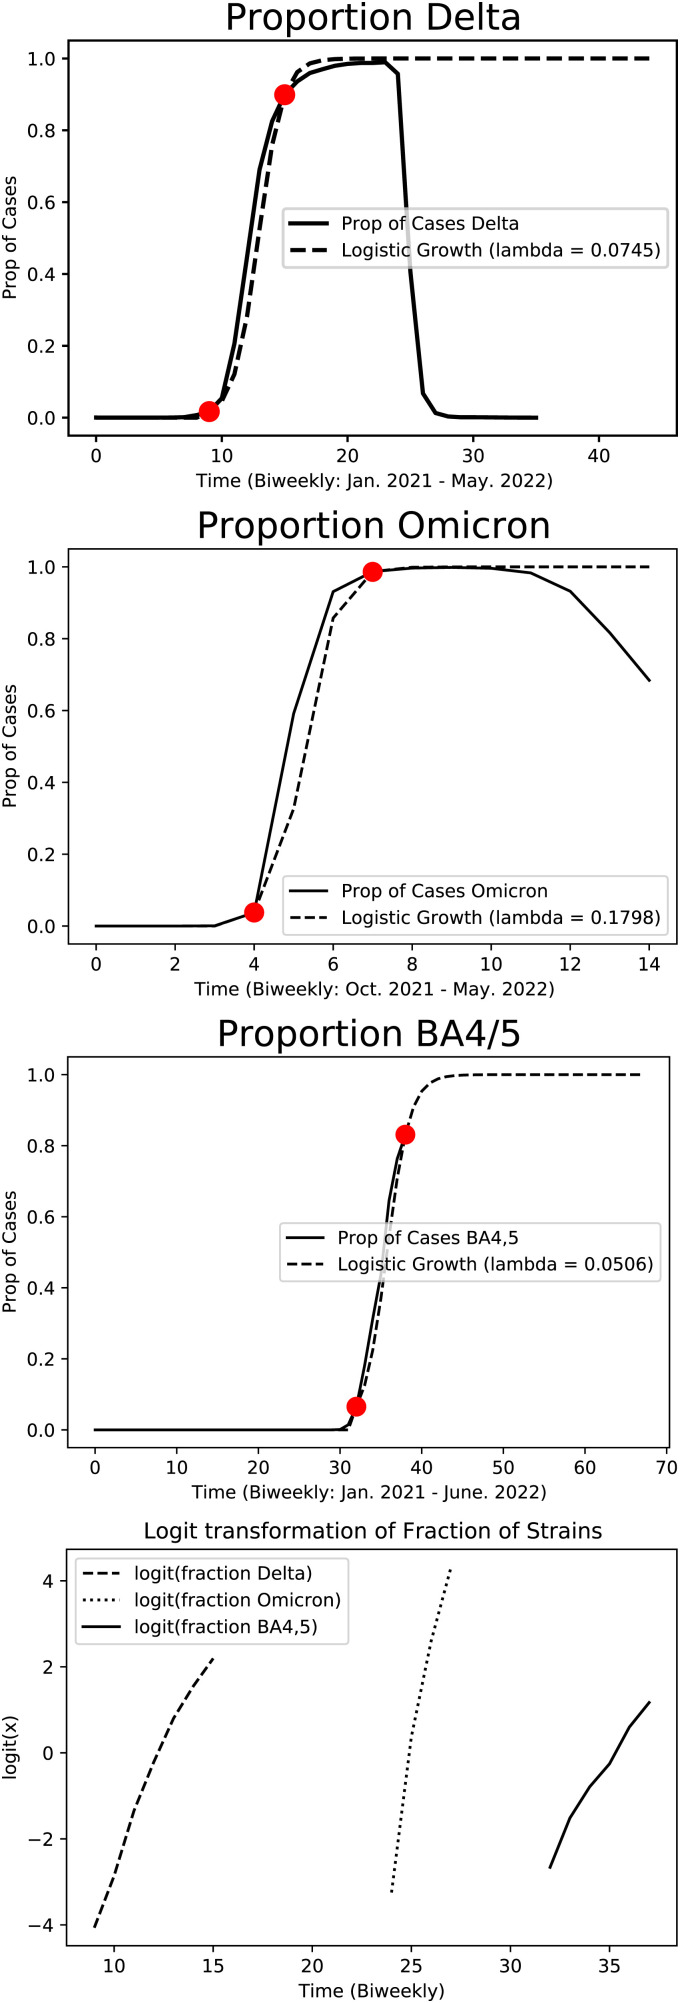
Fig. 4.
The top three panels show logistic fits to COVID variant transitions. If the fraction of cases due to the new variant, x(t), was the solution of a logistic equation, then would be linear. In the bottom panel, we plot this transformation of the three curves. The resulting plots are approximately linear with R2 values 0.98, 0.97, and 0.98, respectively.

