Fig. 2.
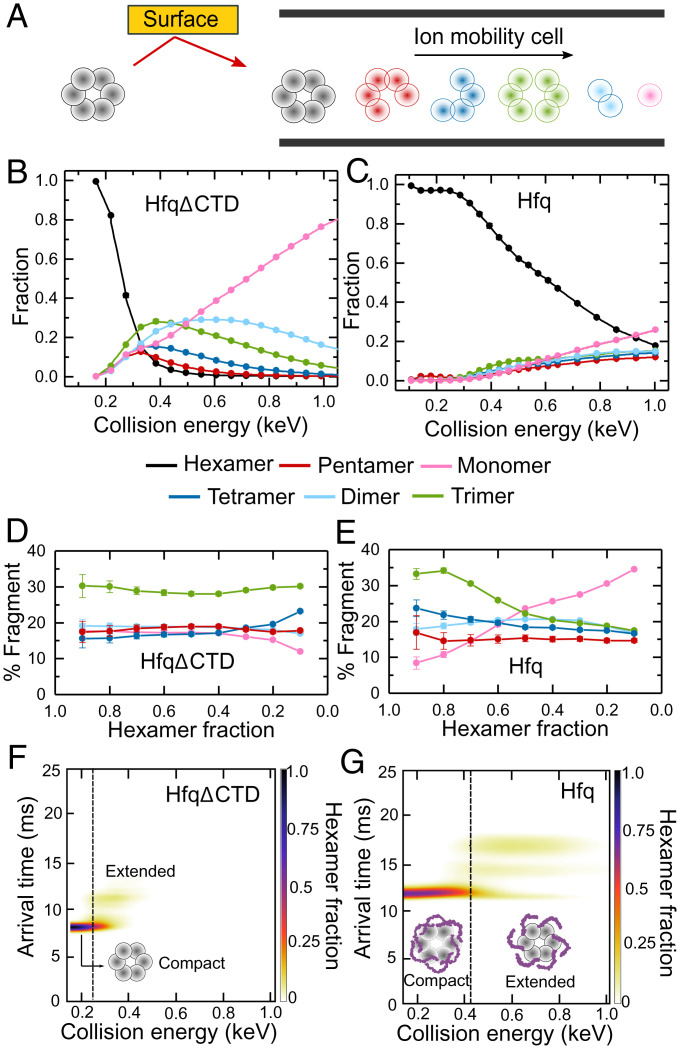
Disordered CTDs stabilize Hfq. (A) nMS-SID dissociates the Hfq hexamer precursor ions into oligomers that retain the connectivity of the native protein. Fragments are separated according to their arrival time after traversing an ion mobility cell (see also SI Appendix, Fig. S1 and Table S1). (B and C) Energy-resolved mass spectrum of (B) HfqΔCTD and (C) Hfq, showing the fraction of each fragment at different CE. The CE are corrected for the mass of the CTDs (SI Appendix, Eq. S1). Reported fractions are the sum of the intensities of each dissociation product normalized by the total intensity of all products. Symbols report the average of three replicates. Some SEs are smaller than the symbols. Solid lines represent a linear interpolation of the data. (D and E) Percentage of each oligomer (pentamer, tetramer, trimer, dimer, or monomer) in the dissociation products, as a function of the remaining hexamer fraction for (D) HfqΔCTD and (E) Hfq. Errors are the spread of the ERMS curves, normalized by the total dissociated fraction and converted to a percentage. Colored as in B and C. Solid lines are a visual guide. (F and G) Surface-induced unfolding (SIU) of (F) HfqΔCTD and (G) Hfq. Extended ions arrive later than compact ions. Color scale, fraction of hexamer; dashed vertical lines, CE at the transition from compact to extended protein, at which the hexamer fractions are ∼0.2 and ∼0.7, respectively.

