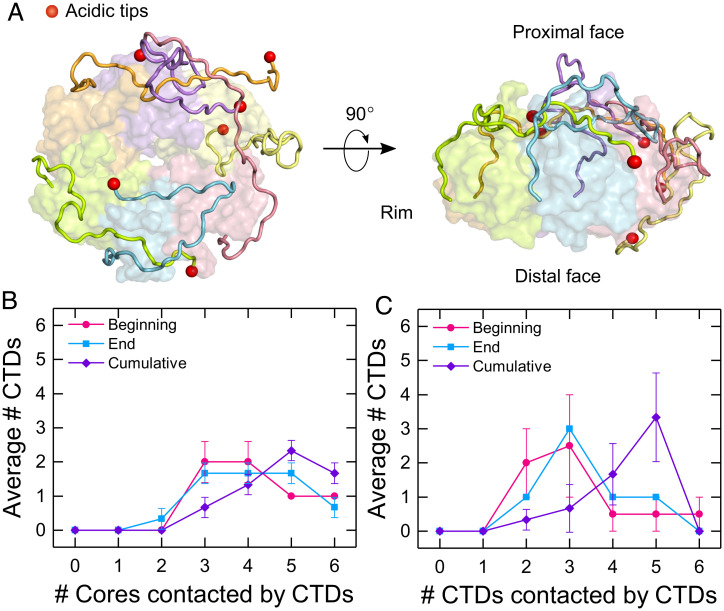
Fig. 3.
Disordered CTDs create a network of interactions with Hfq. (A) (Left) Top and (Right) side view of an Hfq model from one MD simulation (model 5, at 1,500 ns). Subunits are colored individually with each acidic C terminus shown as a red sphere. (B and C) Average number of CTDs interacting with zero, one, two, three, four, five, or six (B) cores or (C) CTDs. Interactions were summed over the first 100 to 200 ns (beginning), 1,400 to 1,500 ns (end), and for the entire simulation (cumulative) for models 1, 3, and 5. Symbols are the average and SEM (of the various simulations. Solid lines are a visual guide.

