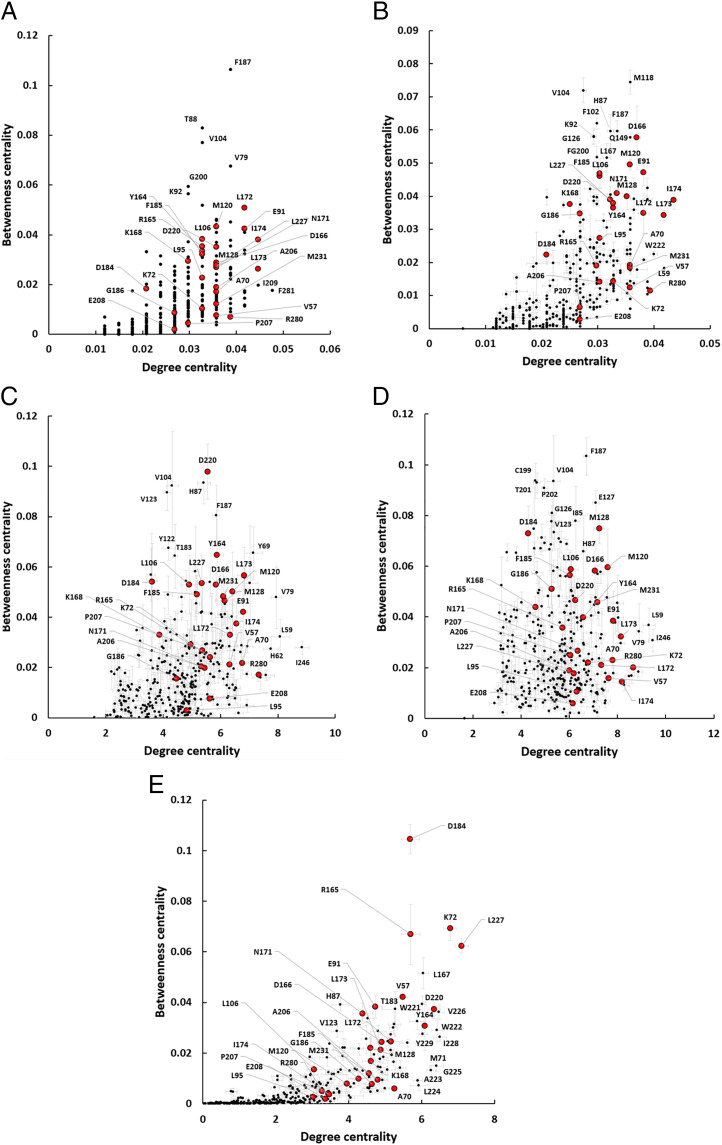
Fig. 5.
BC and DC distribution of 336 PKA residues in five different PRNs based on an SS (A) and NW (B) weighted by CC (C), LMI (D), and LSP alignment (E). For the MD simulation–based PRNs, 6-ns long trajectories were used; 26 key residues are shown in red. SEs for five replications values are shown.

