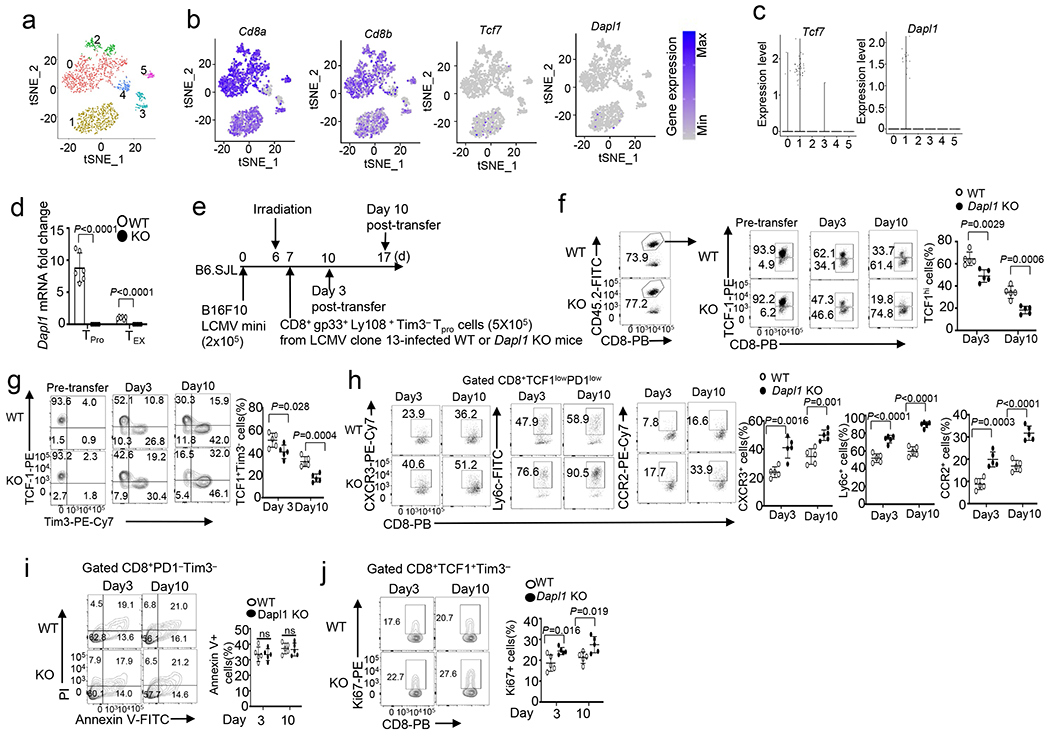
Extended Data Fig. 7. Dapl1 regulates progenitor-like CD8 T cell proliferation and conversion to effector-like CD8 T cells.

a, tSNE plot based on unsupervised clustering analysis of scRNAseq data from human uveal melanoma dataset GSE139829 showing 6 clusters of CD8 TILs. b,c, Expression profile of the indicated genes in each cluster of CD8 TILs (b) and Violin plots showing predominant expression of Tcf7 and Dapl1 in the cluster 1 progenitor population (c). d, qRT-PCR analysis of Dapl1 expression in PD1−Tim3− progenitor (TPro) or PD1+Tim3+ CD8 TEX cells isolated from LCMV clone 13-infected wildtype or Dapl1 KO mice. n = 6 per genotype. e-j, Schematic of experimental design (e) and flow cytometry analysis of the frequency of TCF1hi and TCF1+Tim3− progenitor exhausted CD8 T cells (f,g), CXCR3+, Ly6c+ or CCR2+ effect or CD8 T cells in gated PD1lowTCF1low CD8 T cells (h), apoptotic cells in gated PD1−Tim3− CD8 T cells (i), and Ki67+ proliferative cells in gated TCF1+Tim3−CD8 T cells (j) derived from the tumor of B16F10 LCMV mini tumor-bearing B6.SJL mice on day 3 and day 10 following adoptive transfer with antigen-specific progenitor CD8 T cells sorted from the spleen of LCMV clone 13-infected wildtype and Dapl1 KO mice. Data are shown as representative plots and summary graphs. n = 5 per genotype. Summary data are shown as the mean±s.d. with P values determined using a two-tailed unpaired Student’s t-test (d, f-j). ns, not significant.
