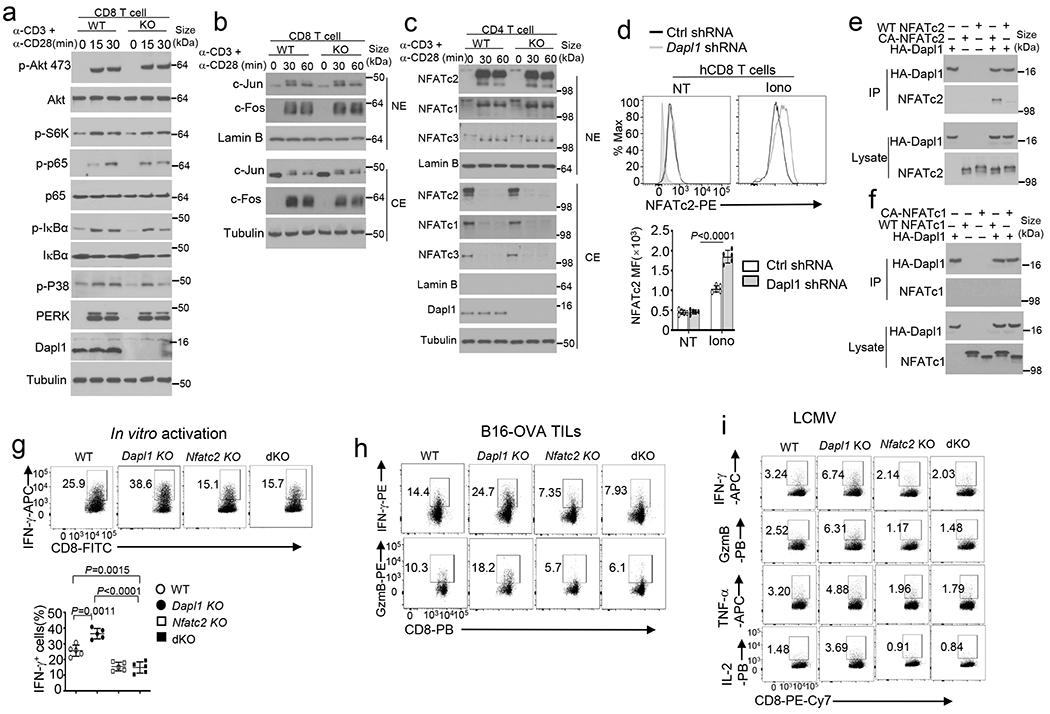
Supplementary Fig. 8. NFATc2 is regulated by Dapl1 and mediates the hyper-responses of Dapl1 KO CD8T cells.

a-c, Immunoblot analysis of the indicated phosphorylated (p-) and total proteins in whole cell lysates (a) or in cytoplasmic (CE) and nuclear (NE) extracts (b,c) of wildtype (WT) or Dapl1 KO (KO) CD8 (a, b) or CD4 (c) naïve T cells stimulated with anti-CD3 plus anti-CD28 for the indicated time points. d, Flow cytometry analysis of nuclear NFATc2 in human CD8 cells transduced with a non-silencing control shRNA (Ctrl shRNA) or Dapl1-specific shRNA, either not treated (NT) or stimulated for 30 min with ionomycin (Iono). Data are presented as representative FACS plots (upper) and a summary graph (lower), n=5 biologically independent repeats. e,f, CoIP analysis of Dapl1 interaction with NFATc2 (e) or with NFATc1 (f) in 293 T cells transfected with (+) HA-Dapl1 along with (+) wildtype NFATc2 or a constitutive active NFATc2 (CA-NFATc2) (e), wildtype NFATc1 or a constitutive active NFATc1 (CA-NFATc1) (f). g, Flow cytometry analysis of intracellular IFN-γ in naive CD8 T cells from the indicated genotypes, stimulated for 48 h with anti-CD3 and anti-CD28. Data are presented as representative FACS plots (upper) and summary graphs (lower). n =5 per genotype. h, Flow cytometry analysis of IFN-γ- or granzyme B-producing CD8 T cells in the tumor of the indicated mouse strains injected subcutaneously with 2×10⁵ B16-OVA cells for 16 days. i, ICS and flow cytometry analysis of gp33-41 antigen-specific CD8 T cells producing the indicated cytokines in the spleen of LCMV clone 13-infected (for 30 days) wildtype (WT), Dapl1 KO, NFATc2 KO and Dapl1-NFATc2 double KO (dKO) mice. The splenocytes were restimulated in vitro for 6 h with gp33-41 peptide in the presence of monensin before ICS. Summary data are shown as the mean±s.d. with P values determined using a two-tailed unpaired Student’s t-test (d,g). Western blots are representative of three independent experiments (a-c, e).
